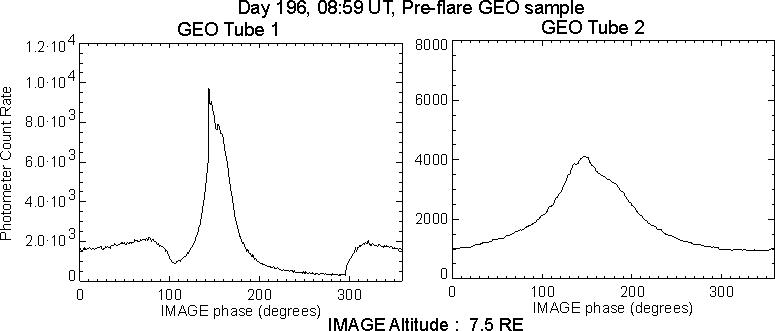
Two of the three GEO tubes are also used to characterize the increase in resonantly-scattered Lyman-Alpha emissions, as well as the brightness of Earth's limb. An example of GEO response for a single spacecraft revolution is given below.

The left-hand plot shows the instrument response as it transists Earth. The peak response is at Earth's limb, where OI airglow emissions contribute approximately 50% of the total response. The right-hand image shows the instrument response as it transits Earth's geocorona. The peak in this scan is due almost entirely to resonantly-scattered solar HI Lyman-Alpha.
In contrast to the imaging observations, only the peak brightness in
each IMAGE revolution is isolated and plotted as a function of time. The
variability in the peak brightness due to the flare is evident, especially
when compared to the more regular variation observed in the previous orbit.
The left-hand plot shows the peak response of GEO Tube 1 for several hours about the flare time. The dashed line shows the peak response for the previous orbit for reference, while the dot-dashed line indicates the X-Ray data from GOES. The delay of 6-8 minutes between the X-Ray peak and the FUV brightness enhancement is evident.
The left-hand plot shows the peak brightness measured as the FOV of GEO Tube 2 transits the brightest portion of Earth's geocorona. This is exclusively a HI emission line (terrestrial plus galactic background). The flare effect is noteably less in magnitude than in any of the other FUV observations.
Each plot shows a residual enhancement in instrument response after
the flare event, an effect which is especially clear in tube 2 (left-hand
plot). This is the effect of energetic solar proton impact upon the photometer.
The heightened count rates are consistent with that observed in WIC images,
though the low proton flux and great dynamic range of WIC tends to mask
the effect. This effect is not seen in the SI instrument.