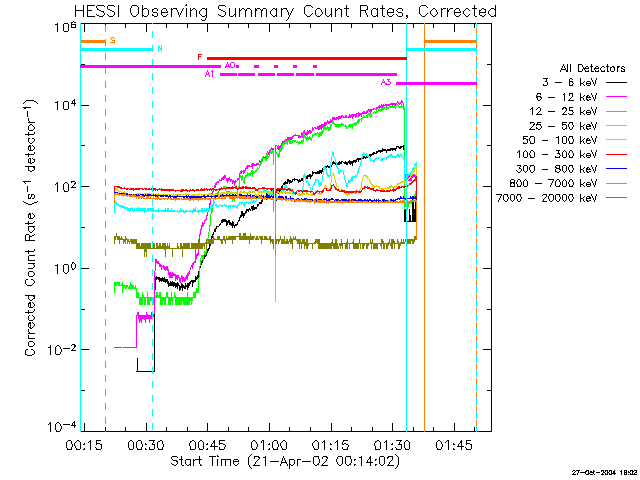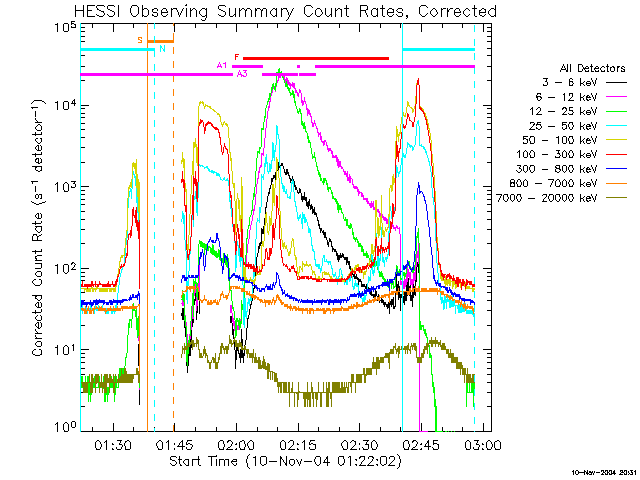


The top row shows the well-studied event of April 21, 2002, and each successive panel is another event. These plots show approximate count rates in different RHESSI energy bands and also show the conditions of observation. "A3" for example marks the time of observations with the thick shutter, A1 the thin shutter, A0 no shutter. See Kim's RHESSI documentation for full info; note that the plots I present are the "corrected" ones.

|

|

|

|

|

|