 | |||
           |
Example of the Three Types of Auroral Acceleration Regions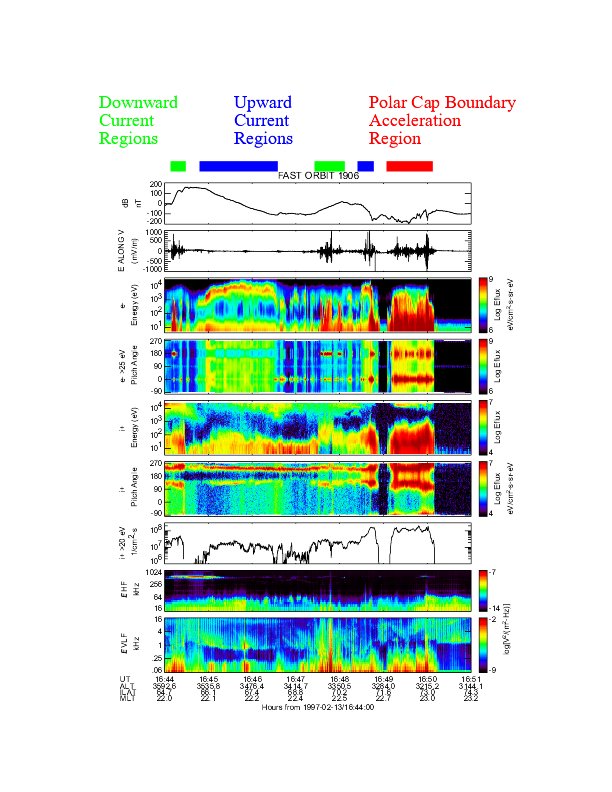
In this figure the three regions of the auroral zone during a substorm expansion is shown using the DC magnetic field data to obtain the magnetic field perturbations from a model magnetic field (panel 1); the electric fields measured along the spacecraft velocity vector, v (panel 2); the electron differential energy flux as a function of energy and time as well as pitch-angle and time (panels 3 and 4); the ion differential energy flux as a function of energy and time as well as pitch-angle and time (panels 5 and 6); the ion pitch-angle integrated energy flux using ions with energies between 20 eV and 24 keV (panel 7); and the electric field high frequency (HF) and very low frequency (VLF) wave spectra (panels 8 and 9). The green bars on the top panel indicate the downward current region, the blue bars the upward current region, and the red bars the Alfvťn dominated region. The Alfvťn dominated region, nearest the polar cap boundary, has little net current (Panel 1) yet has intense Poynting flux and the highest ion outflow (Panel 7). Alfvťn waves can be seen in the electric field signal (Panels 2 and 9) and in the electron signatures (panel 3) from ~16:48 UT to ~16:50 UT The upward current region precipitation from ~16:45 UT to ~16:47 UT appears to come from static potentials. Webpage maintained by Webster. | ||