Solar flares - RHESSI's main business - turn out to be powerful sources of high-energy radiation, specifically X-rays and γ-rays. The hard X-ray (>20 keV) and direct γ-ray (MeV) radiations directly reveal the acceleration and transport processes of the energetic particles - electrons and ions, respectively. Hard X-ray emissions are produced by electron-ion bremsstrahlung of supra-thermal electrons and direct γ-ray lines are produced by the nuclear de-excitation of the "target" ions after their collisions with accelerated ions, at typical energies many MeV per nucleon.
Analyses of particular hard X-ray and γ-ray bursts have shown that the time of the peak intensity depends on the photon energy. Such observations, initially explained by a "two-step" acceleration process, can be reproduced more simply by taking into account transport effects during the propagation of the particles trapped inside closed magnetic structures.
In this nugget, we show how to produce the delay observed by RHESSI between the X-ray and γ-ray fluxes during its first γ-ray flare (the event of 23 July 2002) by a "trap-plus-precipitation" model.
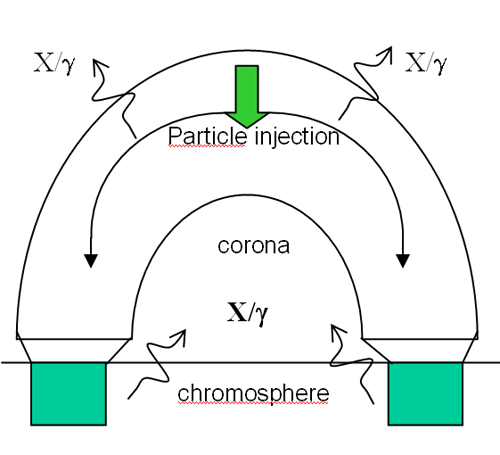
The principle of the model is illustrated by the following cartoon.

Particles injected into the corona propagate at a velocity v in a closed magnetic loop of length L and produce hard X-ray and γ-ray radiation calculated with a "thin target" (instantaneous emission) approximation. The magnetic mirror force, acting in the convergent chromospheric magnetic field, defines the size α of the loss cone and hence determines the trapping. Particles whose pitch angles scatter into the loss cone precipitate into the denser chromosphere. There they produce hard X-ray and γ-ray radiations as they stop collisionally and come to rest. The free parameters of the model are the precipitation rate α2v/L of the particles into the chromosphere, the density of the ambient medium, the spectral index and the time evolution of the injected particles.
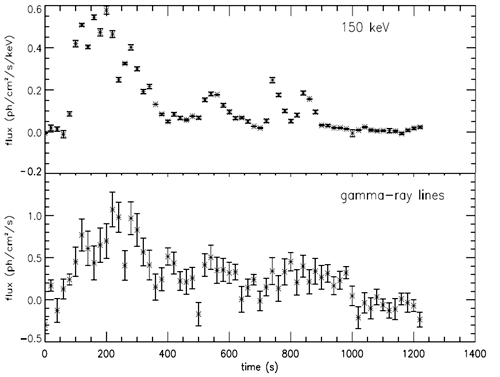
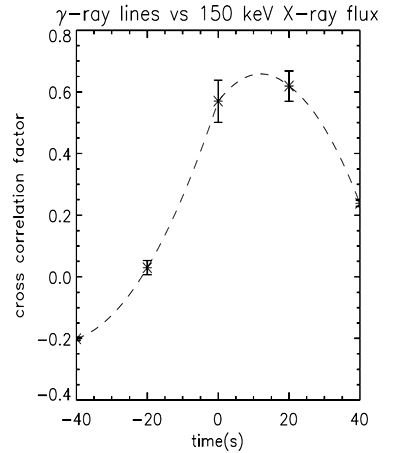
Figure 1 shows the hard X-ray time profile at 150 keV and the γ-ray time profile in the nuclear lines during the 23 July event 2002, following the analysis of Share et al (2003). This event shows a nice delay between the hard X-rays (which precede) and the γ-rays, as shown by the cross-correlation analysis in Figure 2. The delay is about 12 s, much longer than the time for these nearly relativistic particles to transit the flare dimension. We want to know if we can reproduce this delay with the trap-plus-precipitation model described above.


To answer to this question, we start with the assumption that the time profile of the injected electrons and ions follows the time profile of the hard X-ray flux at 150 keV. We reproduce the first part of the hard X-ray flux (between 0s and 400s) with a parabolic function of 400s duration. The other parameter that we can fix is the spectral index of the accelerated protons and alpha particles, determined to be about 3.75 from the published analysis of the RHESSI data.
We use these two parameters to compute the X-ray/γ-ray time
delay (δt) as a function of the density and the precipitation rate.
The strong de-excitation lines at 6.129 MeV from 16O, 4.438 MeV
from the first excited state of 12C populated directly
and by the
spallation reactions on 16O, 1.779 MeV from
28Si, 1.634MeV from 20Ne, 1.369 MeV from
24Mg are computed.
The results, presented in Figure 3, shows that the observed time delay
of 12s can be reproduced for a density between
2 x 1011 cm-3 and 1010 cm-3
and a ratio α2/L between 10-7 km-1
and
5 x 10⁻⁵ km-1.
This result agrees with the density 6 x 1010 cm-3
deduced from soft X-ray observations.

Our simple model assumes that both kinds of particles (electrons and ions) get accelerated simultaneously, but that the ions remain for a certain time in coronal magnetic loops due to magnetic mirroring. With reasonable parameters for this process we can reproduce the observed delay; this lends credence to the idea that the energetic ions responsible for the γ-ray emission might appear in the actual flare loops as observed in soft X-rays. We cannot yet infer this directly from γ-ray images very well (this should be a future nugget) because of limited angular resolution.