Introduction
In the classical
"thick target" model of a solar flare, high-energy
electrons are accelerated at some reconnection site in the corona.
The electrons stream down the magnetic field lines to the chromosphere
where they are stopped by the dense plasma and produce hard X-ray
emission by collisional bremsstrahlung.
The plasma at the footpoints then heats up, and "evaporates" into the coronal
magnetic loop, producing thermal soft X-ray emission.
From the early 1970's hard X-ray emission has occasionally been
seen in the corona as well, initially in occulted events (flares
with the footpoints behind the limb).
These first events were
interpreted to be thermal bremsstrahlung from hot coronal plasma,
with significant thick target emission only at the footpoints. The
first observation of an impulsive, and by implication non-thermal
coronal source, was the famous
Masuda flare.
Later Yohkoh studies of X-ray flares demonstrated that coronal sources
exhibit both gradual and impulsive hard X-ray emission.
Since its launch in 2002 RHESSI, has observed a number of both
moving and stationary coronal sources.
The frequency of these sources and the diversity of the physics they show
us has been one of the major developments of the RHESSI era.
Theoretically one of the simplest
explanations for coronal sources, particularly in flares with little
or no footpoint emission, is an enhanced coronal density, but then
we must explain how the density came to be so large in the first
place.
We must also ask whether these dense regions can be observed in other
ways, e.g. via the techniques of
solar radio astronomy.
The 14th April 2002 flare
We have studied a flare in which RHESSI observes emission up to 50 keV,
definitely in the "hard" or "non-thermal" energy range.
This unocculted M3.7 flare, on the 14th of April 2002, showed hard
X-ray emission primarily from the corona, with little or no footpoint
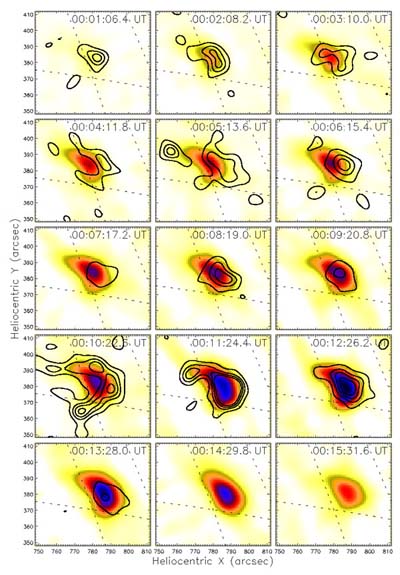
emission during most of the event (see Figure 1).
This was interpreted in terms of high coronal column densities:
electrons up to ~50 keV actually stopped high up in the corona,
in effect producing a coronal thick target.

Figure 1:
Rhessi images at 6-12keV with overlayed contours at 25-50 keV.
Footpoint emission is only visible in the higher energy band for a brief
period during the flare maximum, around 00:10 UT.
During the rest of the flare the X-ray emission is confined primarily to
the loop top (image courtesy of Astrid Veronig).
At the onset of this event emission measures derived from the GOES
soft X-ray data suggested that the column density was already rather
high, ~1020cm-2, implying that the loop was already
filled with plasma.
For this flare complementary multi-wavelength observations provided us
with information allowing us to understand the active region evolution
and sequence of events in which the dense loop was born.
Two flares occurred in this active region in close temporal and spatial
proximity and this sequence of flares leads us to propose a series of
reconnections between multiple loops in a 3-dimensional field geometry.
Model of the loop interaction
The loop in which the M3.7 flare occurs can be seen to brighten
gradually both in EIT 195 Å and 17 GHz (radio microwave band) just
after the impulsive phase of the earlier flare.
Combined with the already bright, polarised radio emission from the
southern footpoint, this is evidence that fast electrons may already
have been present in the flaring loop (see Figure 2).

Figure 2:
The evolution of the microwave emission (grayscale images) over the course
of the flare; contours show radio polarization.
The first panel shows the latter half of the earlier flare.
The second image is from between the flares.
The third panel shows the whole loop in which the M3.7 flare occurs
beginning to brighten and the fourth image shows the whole loop at the
peak of the flare (image courtesy of Stephen White).
The earlier flare occurs at the interface of two active regions
through reconnection it forms a small dense loop between the two
active regions and an area of overlying field.
The small loop, observed to be initially rather dense, becomes unstable;
this leads to further particle acceleration and density increase and the
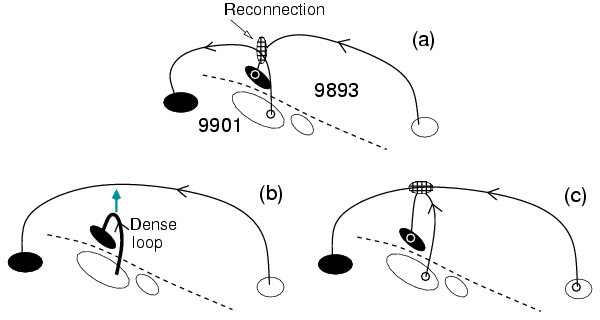
rise of the loop which interacts with the overlying field (see Figure 3).

Figure 3:
The sequences of reconnection occurring between the magnetic loops
in the two flares.
The initial reconnection forms the overlying loops and the smaller dense loop,
which then rises and interacts with the overlying field
(image courtesy of Lyndsay Fletcher).
We estimate that a column density
of up to 2×1020 cm-2 could have been evaporated
during the initial flare. If only a fraction of this plasma is
transferred onto the small dense loop, then the this may account
for the already-high column density at the onset of the second
flare.
Conclusions
We propose that plasma evaporated in an earlier flare may account
for the already high plasma density at the onset of a second flare.
The usual two-dimensional flare model runs into some trouble here as
within this framework the electrons accelerated in the later flare
would have almost no access to the dense loop created by an earlier
event.
However using multiwavelength observations to build up a three-dimensional
picture of the magnetic configuration in which the
flares occur, we see that reconnection may produce a short sheared loop
onto which plasma evaporates.
This loop then becomes unstable,
allowing a second flare in which the density increases further and
few accelerated electrons reach the footpoints.
Biographical
note: Laura Bone is a PhD student at the University of Glasgow.
This work was carried out in collaboration with John Brown, Lyndsay
Fletcher, Astrid Veronig and Stephen White.


