Introduction
As J.R.R.
Tolkien put it in his most famous book, three does not necessarily
have to be a crowd, but it also means company.
In this case, I am not
talking about Hobbits
, but about RHESSI flares featuring three hard X-ray sources.
We have done an extended "imaging spectroscopy" study on well-observed
events, each having three hard X-ray sources. In all events, one
source was visible at low energies (coronal source, in two events
over the limb) and two sources were visible at high energies (footpoints).
We analyzed the spectral time evolution of the individual sources.
In this nugget I will focus on the coronal source and a most
interesting finding: The coronal source shows SHS.
SHS
What stands behind this cryptic jargon?
It is an abbreviation for "soft-hard-soft"
and describes a feature in the time evolution of non-thermal flare
spectra.
It was first discovered by Parks
& Winckler in 1969 and has been studied extensively since.
In many flares, a hardening of the spectrum can be observed as the
flux increases.
A very nice picture illustrating this can be found
in these earlier
nuggets by Paolo Grigis and
by Arnold Benz.
In some cases, "soft-hard-harder" (SHH) is also observed;
refer to this
earlier nugget for a discussion of one such event.
But back to SHS.
The big question is now: Is this SHS phenomenon a feature of the
particle acceleration mechanism, or is it instead
caused by transport effects such as Coulomb
collisions or an electric field?
All previous studies have
been made with full-sun spectra (no imaging), which are dominated by the
footpoint emission at the relevant energies, so basically one has observed
footpoint-SHS.
RHESSI however provides the possibility of high-resolution imaging
spectroscopy, so we can now analyze individual sources.
Observations
We analyzed five well-observed events, each showing three well separated
sources, for the time interval when all sources where strong enough
for reliable imaging spectroscopy.
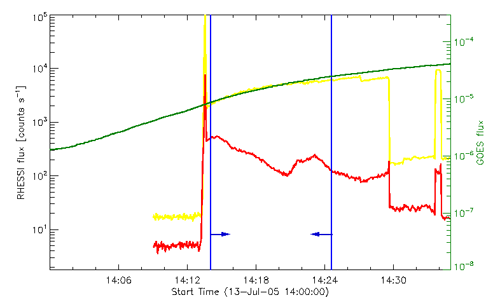
Lightcurves of one of them are
shown in Fig. 1:
 Figure 1: RHESSI lightcurves at low energies (3-12 keV,
yellow) and high energies (25-50 keV, red) with GOES lightcurve
(green). The blue lines give the analyzed time interval.
An image of the event is given in Fig.2.
It shows a source at
low energies, well above the solar limb, and the contours of two
footpoints which image only at higher energies:

Figure 2:
"Clean" image of one event at energies 10-12 keV.
The limb is given, as well as the contours of the footpoints at 34-38 keV.
Results
For each of the sources we calculated a spectrum
and fitted it with a thermal component at lower energies and a
non-thermal power law at higher energies.
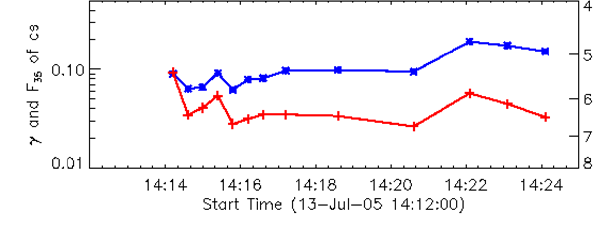
The time evolution of the power-law index of the coronal source (the
inverse of its spectral hardness, thus plotted upside-down) and the flux at
35 keV yields the following picture:
 Figure 3:
Time evolution of spectral index (red) and non-thermal flux at 35 keV
(blue) of the spectra of the coronal source.
It is clearly notable that flux and inverse spectral index go up and down
together.
A very similar pattern is found for the coronal sources of the other four
events.
In one sentence: The coronal sources show SHS-behavior.
Physical relevance
What does this finding tell us?
We believe that we have found strong evidence that SHS cannot be a
transport effect.
Coulomb collisions acting as a filter for low-energy electrons in the loop
would not have a reactive effect on the coronal source.
An electric field due to the return current, driving low-energy
particles back up the loop, would even yield a softer spectrum in the
coronal source.
We conclude that SHS is a feature of the acceleration process itself.
Biographical note:
Marina Battaglia is a PhD student at ETH Zurich in the group of Arnold Benz.


 Figure 3:
Time evolution of spectral index (red) and non-thermal flux at 35 keV
(blue) of the spectra of the coronal source.