The key to RHESSI's spectroscopic success lies in the properties of "hyperpure" germanium, which has the property of converting energy deposition precisely and linearly into electric charge, which can then be amplified and processed. Such a counter has a prototype in the "proportional counter", which introduced to physics the idea of "non-dispersive spectroscopy," in which one measures the energy of individual photons rather than using prisms or gratings to sort the energies. Non-dispersive spectroscopy, although usually of lower resolution, has the multiplex advantage, meaning that RHESSI can measure all photons of any energy at all times; no spectral scanning is required.
So how do germanium (Ge) solid state detectors work? RHESSI carries nine large hyperpure Ge crystal detectors. When a photon deposits its energy within the detector, electron-hole pairs (charges) are produced. To sweep up these charges, one needs a strong electric field. The figure below shows the pattern of electric field lines resulting from the high voltage (-4000 V) applied to the outer surface of the detector:
The electric field configuration effectively splits the detector into two separate sections, the front and rear. An interruption in the inner contact allows these to be read out through separate chains of electronics. One RHESSI Ge detector acts like two! The front detectors catch the lower energy (not so penetrating) X-rays, while very energetic (penetrating) gamma rays travel right through the front and are caught by the rear section. The front-back geometry of the segmentation thus serves to shield the rear part of the Ge from the flood of lower-energy X-rays always produced by a solar flare.
The main reason to use germanium -- an expensive detector material that must be operated below 100K -- is its superb energy resolution. Photon energy can be measured to within about 1 keV for hard X-rays in the front segments (below about 200 keV) and to within about 2 to 5 keV in the rear segments. For an MeV photon, this is a very high accuracy! It not only allows solar gamma-ray lines to be identified with specific nuclear processes, it even allows their Doppler profiles to be studied, in analogy to optical spectroscopy. Figure 2 shows an intrinsically narrow solar gamma-ray line from RHESSI's first gamma-ray line flare.

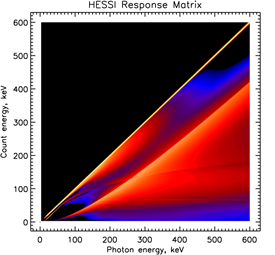
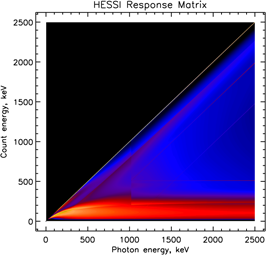
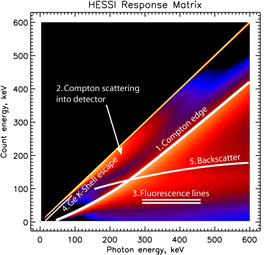
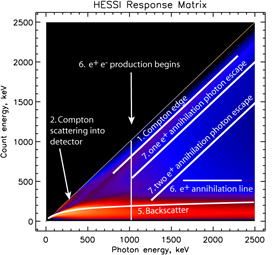
When a very energetic photon interacts with the Ge, several things can happen. The simplest process is that all of the energy of the photon is deposited inside the germanium volume (via the mechanisms of photoelectric absorption, Compton scattering, and electron/positron pair production). If one were to plot detected count energy versus true photon energy then this response would be diagonal. Unfortunately, life is not always that simple; often, you don't get all the energy of the photon. The following two images show the response matrix for the front and rear detectors.

|

|
The non-diagonal response is quite complex and includes many different
processes, though most of the response at low energies
is actually in the "diagonal elements" of the matrix, the thin yellow line.
Above a few hundred keV, the
off-diagonal response makes up the majority of the counts.
Here are these plots again with specific features marked.

|

|
The purpose of this RHESSI science nugget was just to introduce some of the ideas behind X-ray and gamma-ray spectroscopy, which is a somewhat obscure subject in astrophysics because of its extraordinary difficulty. In spite of this difficulty, the off-diagonal effects can be rather well accounted for by a combination of simulations and laboratory measurements. Removing the effects of the off-diagonal response is part of the RHESSI software. Future science nuggets will discuss some of the observations made with this system.