Introduction
The "ribbon" structures of solar flares have long been observed
at H-alpha and UV wavelengths.
In the
standard flare model, the ribbon
structure in the lower atmosphere represents a series of footpoints of
coronal arcade loops that result from magnetic reconnection at a coronal
X-point, and the well-observed separation motion of the flare ribbon is
interpreted as successive reconnections that takes place higher and
higher above the arcade.
This is essentially a 2D picture and we do not know yet how well it
translates to 3D, but it certainly appears to organize the data
observed during the gradual phase of a flare.
On the other hand, flare hard X-ray emissions
often exhibits point-like compact sources, often two though sometimes only one,
which lie within the H-alpha/UV ribbons.
This difference between the spatial distributions of
ribbons and the hard X-ray sources is widely
recognized by experts and is an active subject of research.
One explanation was proposed by Asai et al. (2002), who interpreted the
more confined hard X-ray kernels as regions of more intense energy release
which might be expected in the strongest-field parts of the ribbons.
Prior to RHESSI there were few reports of ribbon-like images in hard X-rays.
The first was the Yohkoh/HXT observations reported by
S. Masuda et al.
These were the ribbons of the celebrated Bastille Day 2000 flare,
a complicated X5.7 event.
The ribbons could be seen even in the HXT High channel, 53-93 keV.
Such observations suggest that electrons are accelerated in the whole
system of a coronal arcade, and not merely in a particular dominant loop.
RHESSI has now brought new insight into the distinction between the
H-alpha-inspired ribbons and the hard X-ray footpoints.
This nugget reports on observations from a flare of 2005 May 13, whose date
incidentally echoes the date in 1981 of a memorable
Hinotori flare.
The 2005 May 13 flare
We have found ribbon-like hard X-ray sources during
this M8.0 disk event,
which was associated with a fast halo CME and an intense geomagnetic storm.
We chose a six one-minute time intervals from
the rising to decay phase of the hard X-ray light curve and present the
RHESSI images in Figure 1.
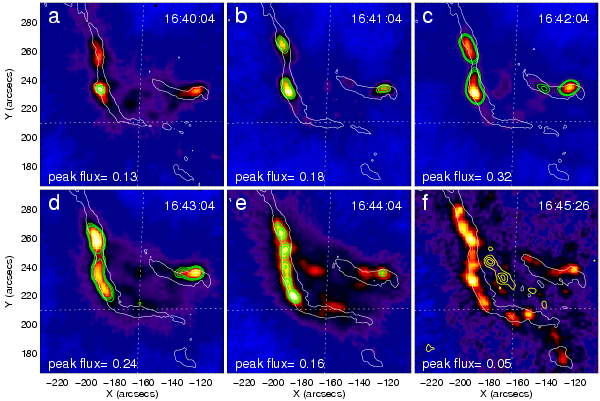
Figure 1: A time sequence of RHESSI 25-50 keV hard
X-ray images across the flare impulsive phase. Each RHESSI image was
reconstructed with the CLEAN algorithm using grids 1-9 with the
natural weighting scheme. The green contours show flux at levels of 0.1, 0.115, and 0.13
photons/cm 2/s/arcsec2.
Panel f also shows RHESSI 6-12 keV image with yellow contours at levels
of 50%, 70%, and 90% of its maximum flux. The white contours outline
the TRACE 1600 Å ribbons taken near the center of each RHESSI
time interval.
We discuss the results as follows. First, hard X-ray emissions appear
as compact sources until the flare maximum (intervals a, b,
and c).
These are located within the flare ribbons.
Four hard X-ray kernels are seen at flare maximum.
As suggested by Asai (2002), we find that the average field strength of the
hard X-ray parts of the ribbons is about two times larger than that of the
other parts of the ribbons (those without hard X-ray emissions).
Second, after flare maximum (intervals d, e, and f)
the hard X-ray sources become elongated and appear to form a true ribbon
structure. This footpoint-to-ribbon evolution of hard X-ray emissions is more evident
for the much stronger eastern hard X-ray sources.
Several kernels can be seen within the
ribbon during time interval e.
At the time interval f, significant
hard X-ray emission (although with a much lower flux level compared
with peak time) is found along the entire length of each ribbon.
The same trend is found at higher energies (50-100 keV), although at lower
energies (6-12 keV) the X-ray sources lie between the ribbons.
This presumably shows high-temperature thermal sources at the tops of the
loops joining the ribbon sources.
We want to understand why the hard X-ray ribbon structure appears so
prominently in this specific event.
Actually, this eruption is also interesting in other respects.
The flaring active region, NOAA 10759, appeared in a conspicuous
sigmoid shape in the TRACE 171 Å channel.
Sigmoid shapes are well-known as special magnetic structures prone to
eruption. Following the event, the visible structure changed from a sigmoid
to an arcade (see Figure 2).
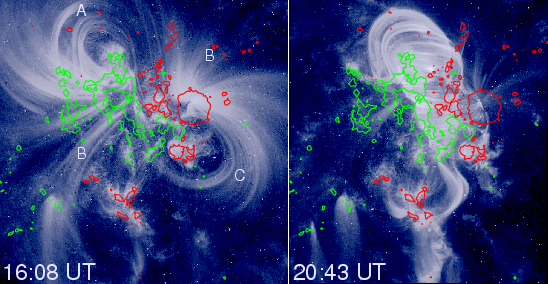
Figure 2: Pre- and postflare images from TRACE 171 Å
channel showing the sigmoid-to-arcade evolution of the coronal magnetic
field. The MDI longitudinal magnetic field is superimposed as red and
green contours representing positive and negative fields, respectively.
We consider a scenario as follows: as in the standard model for
eruptive bipoles proposed especially by Ron Moore and termed
tether-cutting.
Reconnection begins between the two elbows in the middle of the sigmoid
(see Figure 3a), and progressively less sheared field lines from the
outer sigmoid core reconnect.
The hard X-ray sources should be largely footpoint-like at this stage.
At the flare maximum, the envelope is
blown out with the twisted flux rope inside it, after which the opened
legs of the envelope will continue to reconnect and this accelerates
electrons in the whole system of arcade or fan out throughout the
arcade thus leading to the ribbon-like hard X-ray emissions (see Figure
3b).
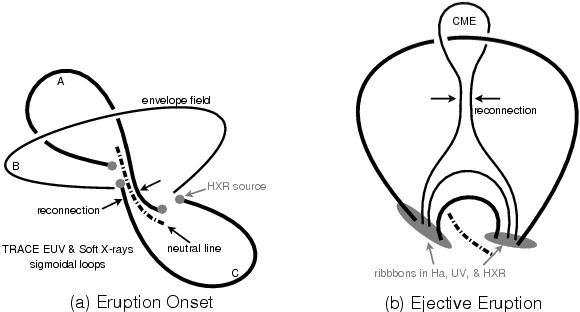
Figure 3: Schematic picture
interpreting our observations, based on the eruptive model proposed by
Moore and LaBonte (among others).
Conclusions
Combined with a rich collection of radio emission
features, this beautiful event shows an picture of the
flare/CME process that is quite similar to the model for sigmoidal
bipoles elaborated by Moore and LaBonte.
We speculate that the
footpoint-to-ribbon transformation of the hard X-ray source morphology
is a natural outcome of the sigmoid-to-arcade evolution of the magnetic
field configuration.
Therefore, this might suggest that only the
events that exhibit a special magnetic field configuration can have
truly ribbon-like hard X-ray emissions.
Biographical note: Chang Liu is a PhD student
at the Center for Solar-Terrestrial Research at New Jersey Institute of
Technology. CL is grateful to Dr. Brian R. Dennis for valuable
discussions. This work is part of a manuscript presenting a
multiwavelength study of this event.