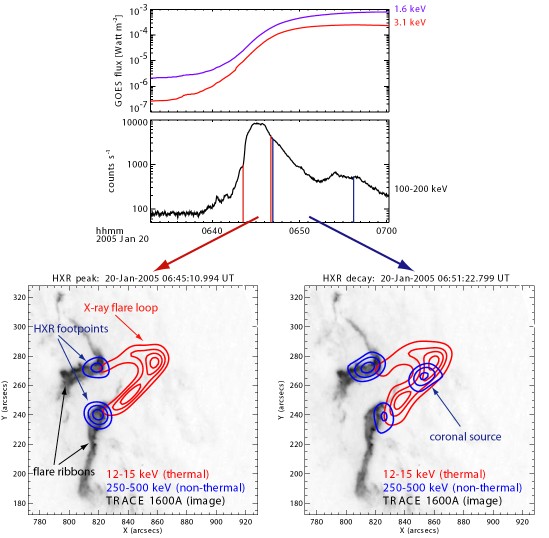
Figure 1.
Solar hard X-ray sources typically occur at the footpoints of coronal magnetic loops comprising a solar flare. The physical reason for this is simple: collisions between particles are needed for X-ray emission, and there are more particles in the denser footpoint regions. Thus the corona itself should be relatively faint. Except for a few scattered examples in the literature, this has generally been borne out by the observations.
Here we report on imaging results in the energy range above 200 keV of our three RHESSI flares with the best counting statistics (the "giant flares" of the title). Surprisingly we find that at gamma-ray energies a large part of the emission originates from the corona and not only from footpoints, especially during the decay phase of the hard X-ray peaks. Furthermore, the coronal emission has a flatter/harder spectrum than the footpoints with power-law indices around ~1.5 to ~2. To obtain these results we make use of little-utilized feature of the RHESSI instrument, as described below.
The RHESSI germanium detectors are electrically segmented into separate front and rear parts. The intense flux of low-energy X-rays (<200 keV) stops primarily in the front segment, so that the >200 keV gamma-rays penetrate to the rear segment without significant saturation. For giant flares this is a giant advantage, because the softer X-ray fluxes from such flares can be truly huge. RHESSI imaging works normally for the rear segments, as established by the pioneering gamma-ray images. So, for the first time, we can study coronal gamma-ray sources with simultaneous imaging and spectroscopy.
Imaging in the 250-500 keV range during the peak of the HXR burst shows the standard flare picture: HXR emission originates from footpoints (blue contours in Figure 1) of the flare loop that is seen in X-rays below 20 keV (red contours).

However, during the decay phase of the HXR peak (which corresponds to the peak time of the GOES soft X-ray time profile) the 250-500 keV image shows a third source in addition. This unexpected source is cospatial (at least in projection) with the main flare loop as seen in thermal X-ray emission.
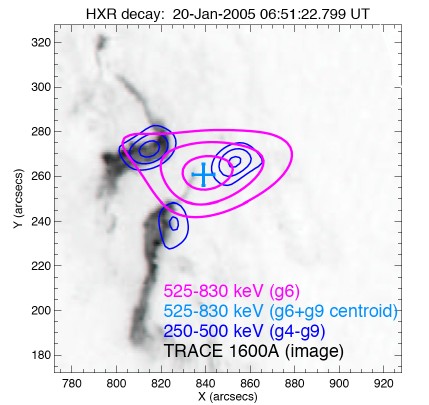
At even higher energies (>500 keV), only two of the RHESSI grids (grid 6 and 9) are thick enough to modulate the incoming gamma-rays significantly and thus make imaging possible. Using these grids only gives spatial resolution of 35" at best, not enough to separate the source components in this case, and so they are combined into a single elongated source with a centroid position closer to the coronal sources than to the footpoints. Images at 525-830 keV show an elongated source with a centroid position closer to the coronal sources than to the footpoints (Figure 2).

The position of the 525-830 keV centroid relative to the coronal and the two footpoint sources seen in the 250-500 keV range suggest that the coronal source is even more intense at higher energies. Our preliminary results show that the coronal source is about twice as bright as the combined footpoint emission at 525-800 keV. This suggests a very hard spectrum of the coronal source, with a power-law index between ~1.5 and ~2. Such a spectrum is extremely unusual in the usual footpoint sources and implies that the X-rays come from relativistic electrons at even higher energies (>1 MeV). The presence of such high-energy particles would be consistent with previous radio observations of synchrotron emission.
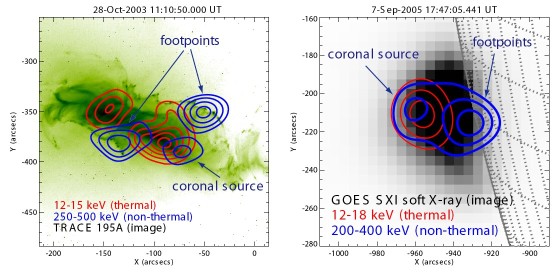
The three RHESSI flares with the best counting statistics above 200 keV are the Oct 28, 2003 (GOES class >X17), the January 20, 2005 (GOES class X7), and the September 7, 2005 (GOES class >X17) flare. All of these flares show coronal emission above 200 keV, but one can never be wholly sure about source height for events seen projected against the solar disk. A limb flare such as that of September 7, 2005 unambiguously show the coronal nature of these emissions projected against the dark sky. Figure 3 shows these events:

We need to confront theory with these remarkable data.
The column density to stop an electron of energy E (keV) is given approximately
by
N = 1017 E2 particles/cm2.
For a 1 MeV electron, this means that a column density of N=1023
cm-2 is needed.
For the January 20 flare, X-ray imaging gives a volume of 2x1028
cm3) and spectroscopy gives an "emission measure"
n2V = 3x1049 cm-3.
These measurements give a density of 4x1010 cm-3
in the flare loop, so that to stop a 1 MeV electron requires
a path length of 2.5x1012 cm.
This is roughly 350 times the flare loop length.
Therefore only highly stable
particle trapping can provide the needed column density.
Electrons at 1 MeV (which have a velocity of
~94% of the speed of light) would need to be trapped for at least ~90 s.
This time scale roughly corresponds to the decay time of the
hard X-ray time profile.
We are working on more detailed calculations of the effects of trapping.