In this nugget, we consider the RHESSI aspect sensors. Though their job is to provide aspect measurements, those measurements can be scientifically interesting in their own right. The RHESSI Solar Aspect System (SAS), which we've written about in a previous Nugget and will certainly write more, consists of linear CCD detectors that make line images across the solar disk. As the spacecraft rotates and precesses, these 1D images map out the whole solar disk in well-calibrated detail, with precise (thanks to SAS!) image stability. The catch is that, with only on the order of 1,000 images per day, it takes a few days to build up a complete image of the visible Sun. This is not rapid enough to allow us to make pretty pictures, but we can certainly study features such as faculae and network brightenings statistically.
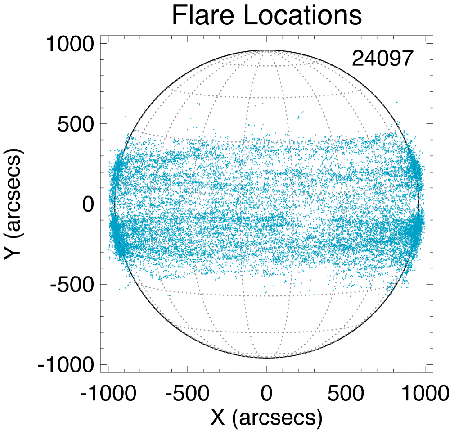
It should not be forgotten that SAS is necessary to make Hard X-ray imaging possible using RHESSI's Germanium detectors (see this Nugget for a more detailed description of RHESSI imaging). In the many years that RHESSI has been observing the Sun, it has recorded innumberable flares, including microflares. Figure 1 shows the locations of >25,000 microflares. They occur in the active latitudes where sunspots live. Upon closer inspection, it has become clear that all RHESSI microflares occur in magnetic active regions, usually with sunspots nearby.

The microflare distribution has a clear north-south asymmetry, with more events occurring in the southern hemisphere. Figure 1 shows the observed locations and have not been corrected for biases. The main bias is the annual apparent solar latitude excursion of the Earth, since our planetary orbit is inclined relative to the heliographic equator. Also an imaging "dead spot" exists about 250 arcseconds east of disk center. The "dead spot" shows where RHESSI's modulation patterns become too small for imaging.
Figure 2 shows the average RHESSI facular brightness excess, now as a function of polar angle and latitude. With this dataset we have made a correction for the heliolatitude of Earth, which varies by 7.25 degrees (times 2) over a year. This is the "solar B-angle." Note that the different treatment confuses things by that amount, in a statistical sense, in the comparison with the microflare locations in Figure 1.

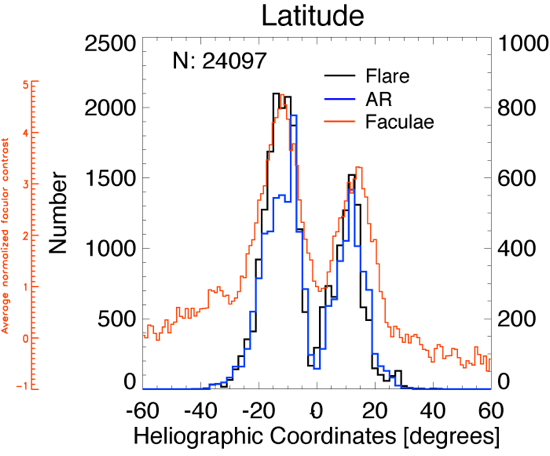
So how do the occurrence patterns compare? This is shown in Figure 3, along with the distribution of sunspots (without regard to area). There is a substantial difference: the faculae have a much broader distribution in latitude. This "discovery" is not really new, since an "enhanced" or "active" chromosphere is known to follow the apparent diffusion of solar magnetic field away from the active latitudes and even to the poles. This is a complicated and fascinating story, but for our purposes it is enough to note that the photospheric excesses RHESSI's SAS is seeing follow these magnetic fields and their chromospheric counterparts.

We have successfully compared RHESSI facular latitudes and RHESSI microflare locations in a mean sense, using 3-5 years of data. This shows what we half-expected, namely that the facule have a broader distribution. This is consistent with our studies of the solar oblateness, which we will report in a future Nugget. In the meanwhile this is a first step in comparing two very different form of solar activity, and we hope to make progress in understanding their relationships in detail.