IntroductionAt high temperatures, the radiation emitted by a plasma includes the free-free (bremsstrahlung) and free-bound (recombination) X-ray continuum radiation as discussed in previous nuggets . But it also includes thousands of very narrow lines from the different elements in the plasma in addition to the dominant hydrogen. These are produced in a myriad of different ways as the atoms in different ionization stages change from one quantum energy state to another and emitting photons at characteristic energies. Fortunately, the latest version of the CHIANTI codes and atomic data base allows the spectrum of both the continuum and the line emission to be calculated for a plasma with a given temperature and an assumed set of abundances for all elements up to iron and nickel. Certain assumptions also have to be made about ionization equilibrium. This should not be a problem during the decay phase of a flare when any plasma is likely to be in thermal equilibrium but may be an issue during the impulsive phase. The elusive evidence for nonthermal equilibrium could be an exciting side-benefit of any discrepancies found between the predicted and measured spectra during impulsive variation. The basic method for determining the abundances of the different elements in the plasma is to measure the intensities of various X-ray lines from each element during a flare. Broadly speaking, the intensity of a line from a particular element for a plasma with a given emission measure and temperature is directly proportional to the abundance of that element. Previous X-ray spectral measurements were made using mainly Bragg crystal spectrometers. These cover narrow energy ranges but with very fine energy (or wavelength) resolution so that individual lines from iron or calcium or sulfur can be resolved. This has allowed the line intensities to be determined very accurately. The problem has instead been to determine the plasma temperature and emission measure with commensurate precision. The thermal continuum X-ray spectrum helps with both these quantities, but it has generally been difficult to measure because of fluorescence radiation from the Bragg-scattering crystals used in the instruments. Instead, line ratios and other techniques have been used in the past to estimate the required temperature and emission measure. Despite these difficulties, a large number of abundance measurements have been made of flaring plasma confirming the "FIP Effect." This is dependence of the elemental abundance on its first ionization potential (FIP). Low-FIP elements (FIP below 10 eV) tend to have higher (factor of 2-4) abundances in flares than in the photosphere while high-FIP elements tend to have the same abundances as in the photosphere, or even lower. The differences in the abundances of different elements in the corona and photosphere offer the intriguing possiblity of being able to determine the origin of the hot plasma that appears during flares. If the abundances tend to be more similar to photospheric, then one could conclude that the plasma originated from the chromosphere as expected from the Neupert effect, in which chromospheric plasma is heated and "evaporates" into the corona. If measured abundances tend to be more similar to coronal values, with enhanced low-FIP elements, then one could conclude that the hot plasma originated from the corona and was directly heated in situ. Measuring such abundance differences during a flare and for different flares would be extremely valuable in understanding the energy release process itself. RHESSI has contributed measurements of the iron-line complex at ~6.7 keV as discussed in a previous nugget . These show good agreement with the CHIANTI-predicted equivalent widths for coronal iron abundances that are four times the photospheric value. Further data analysis suggests complications in this conclusion, though, so it would be nice to have help interpreting the RHESSI spectra. The MESSENGER X-ray SpectrometerA new instrument has recently become available for making solar X-ray observations in the critical 1 to 10 keV energy range. This is the X-ray Spectrometer (XRS) that makes up part of the MErcury Surface, Space ENvironment, GEochemistry and Ranging instrument (MESSENGER). The MESSENGER spacecraft was launched on August 3, 2004. It has already flown past Mercury once and will eventually go into orbit to study the characteristics of the planet and its environment.
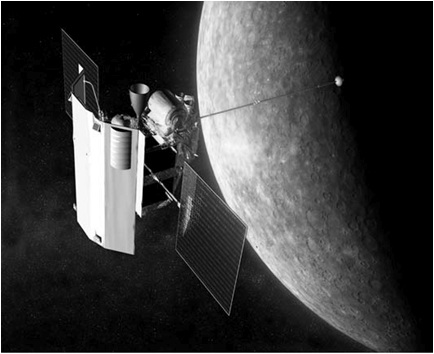
Figure 1:
Artist's impression of MESSENGER in orbit about Mercury,
showing the sunshade on which the XRS solar monitor is mounted.
The XRS consists of three gas proportional counters to detect solar-induced fluorescence from the surface of the planet, plus a small solar monitor mounted on the MESSENGER sunshade (Figure 1). The solar monitor consists of a single Si PIN detector with a sensitive area of only 0.03 mm2. Its primary purpose is to provide the spectrum of the solar X-ray flux incident on Mercury so that the MESSENGER measurements of the resulting fluorescence radiation can be interpreted to provide surface composition. Despite its small size, the XRS solar monitor is providing broad-band measurements of the solar X-ray thermal continuum emission from 1 to 10 keV that give accurate values for the flare plasma temperature and emission measure. Its energy resolution of ~0.7 keV (FWHM) is somewhat better than RHESSI's, and can clearly resolve the line complexes of Fe at 6.7 keV and Ca at 3.9 keV. These abundances can therefore be estimated fairly directly. In addition, the abundances of Si, S, and Ar can be estimated from the increases over the continuum emission resulting from the broad complexes of lines from these elements at energies below 3.5 keV not accessible to RHESSI. Precisely because the XRS detector is so small, it will not become saturated by high counting rates or suffer from pulse pile-up except during the peaks of the very brightest flares. Consequently, we hope that future coincident measurements during large flares with XRS and RHESSI will provide much needed help in interpreting the RHESSI spectral observations below 10 keV and in normalizing the measurements in the different attenuator states. XRS Flare X-ray SpectraThe largest flare seen by MESSENGER since its launch occurred on 1 June 2007. The XRS light curves are shown for four energy bands in Fig. 2. Note that XRS accumulates spectra for 5 minute intervals. This is a limitation for the more impulsive flares in hard X-rays but for the thermal component below 10 keV, this is not such a serious problem although, of course, a higher cadence would have been preferred.
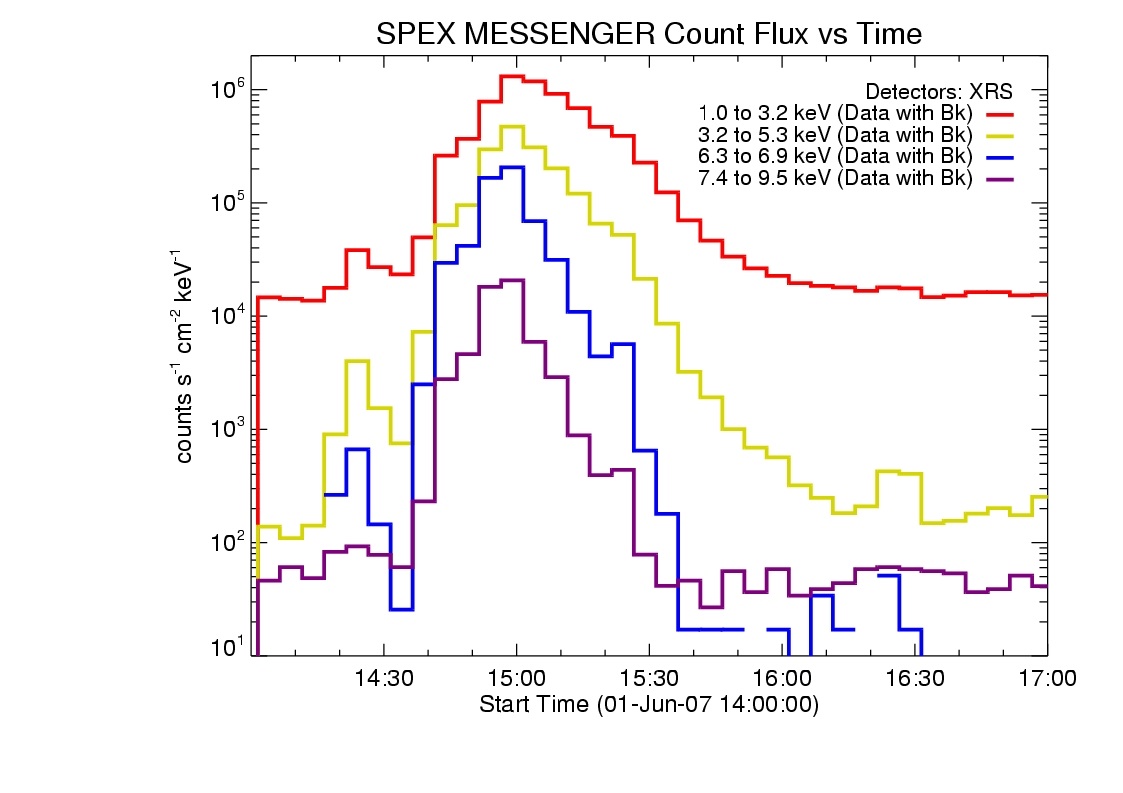
Figure 2:
X-ray light curves measured with XRS in four energy bands for
the flare starting at 14:30 UT on 1 June 2007.
Note that the lower energies show the typical later peak times and longer
decay times compared to the higher energies.
Detailed spectra extending from 1 to ~9 keV are available from XRS for each 5-min. interval during the flare. An example is shown in Fig. 3, where the measured counting rate is plotted versus energy at the time when the best-fit temperature of the emitting plasma reached a peak value of about 23 MK. Figure 4 shows the CHIANTI-predicted contributions of the line and continuum emission from the different elements in the flare plasma to the total count-rate spectrum measured by XRS.
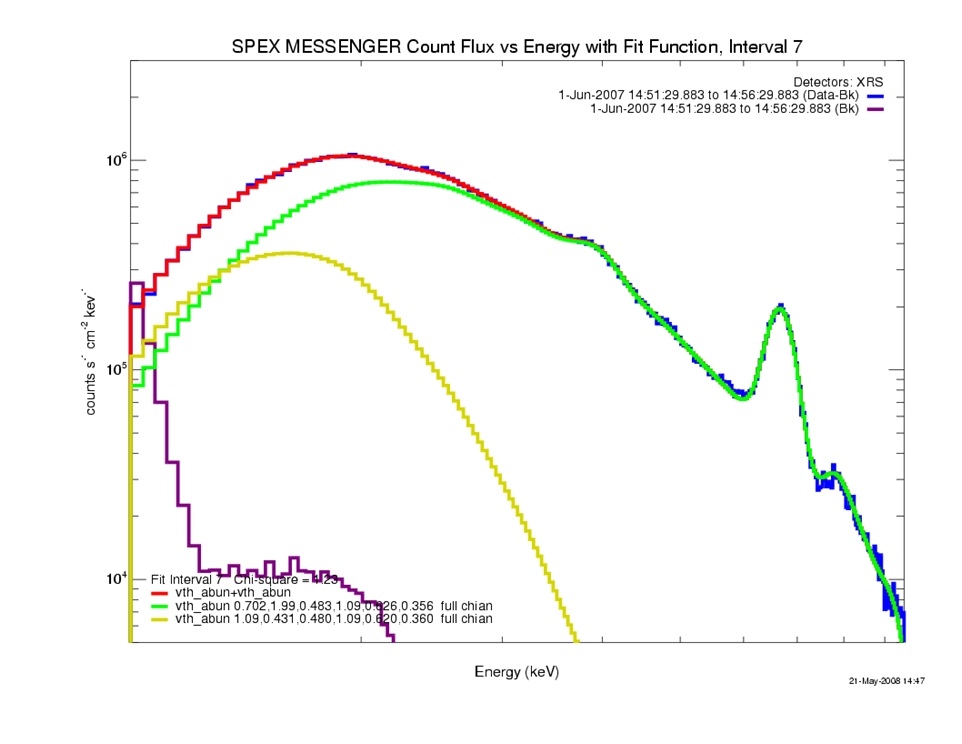
Figure 3:
MESSENGER XRS spectrum with CHIANTI thermal best-fits.
Blue histogram: background-subtracted X-ray count-rate spectrum measured
with XRS at the time of peak temperature during the flare starting at 14:30 UT
on 1 June 2007.
Green and yellow curves: CHIANTI-predicted line-plus-continuum thermal
spectra that when summed (red curve) give the best fit to the data.
Purple histogram: pre-flare backgound spectrum.
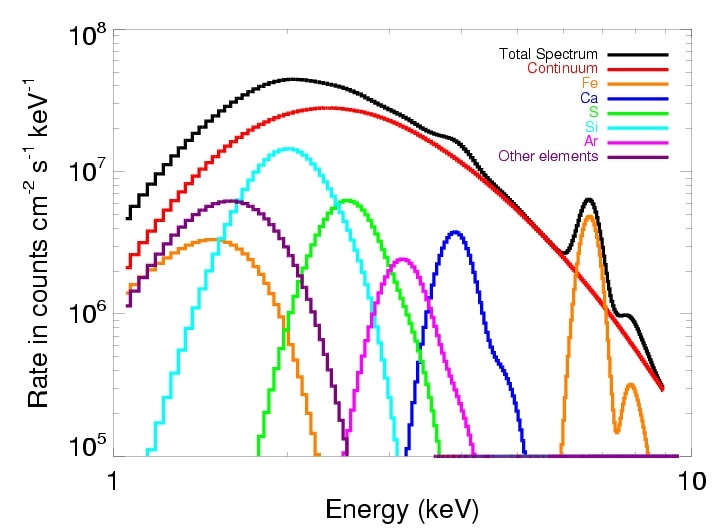
Figure 4:
Continuum and line contributions to the measured XRS count-rate spectrum.
The black curve is the best fit to the XRS count-rate spectrum and the
colored lines are the contributions from the continuum and the line
complexes from the different elements, as shown in the legend.
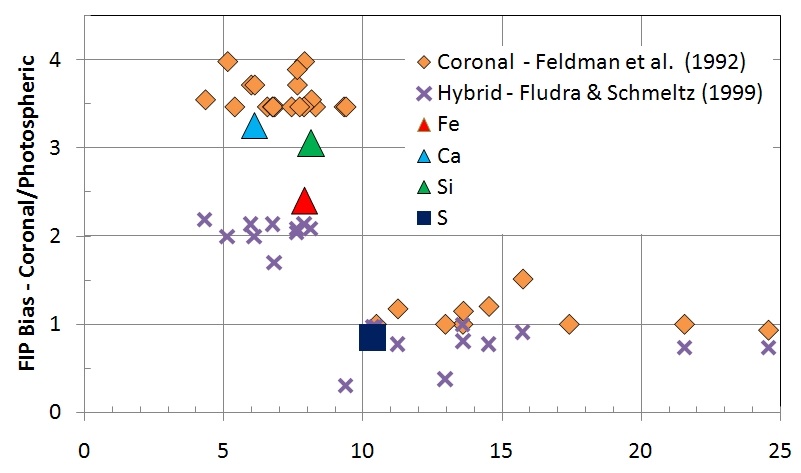
Figure 5:
FIP bias vs. FIP for two different models of coronal abundances used by
CHIANTI and for the XRS-measured values for Fe, Ca, Si, and S averaged
over five ~M-class flares.
ConclusionsThe MESSENGER X-ray spectrometer is providing high-resolution measurements of the soft X-ray emission from solar flares that can be used to determine the elemental abundances of the heated plasma. The preliminary results shown in Fig. 5 suggest that the relative abundances of Fe, Ca, and Si are enhanced with respect the photospheric values but not by as large a factor as given in the "coronal" abundancs used by CHIANTI. The relative abundance of S is consistent with its photospheric value as expected given its intermediate FIP of 10.4 eV. While these early results do not allow a definitive answer to be given concerning the origin of the flare hot plasma, they do suggest that direct in situ heating may play a significant role even during the flare impulsive phase and that chromospheric evaporation may not provide all of the hot plasma to the corona during a flare. Future measurements with XRS of larger flares should address this question more definitively. Biographical note: Brian Dennis is a solar physicist at NASA's Goddard Space Flight Center, and is the RHESSI Mission Scientist and a CoI. Richard Starr is the MESSENGER XRS Inastrument Scientist working for The Catholic University of America at Goddard Space Flight Center.
Webmaster - S. Christe
Editor - H. Hudson
This material is based upon work supported by NASA unless otherwise noted. Any opinions, findings, and conclusions or recommendations expressed are those of the author(s).  
|