By J.McTiernan, 28-Apr-1999
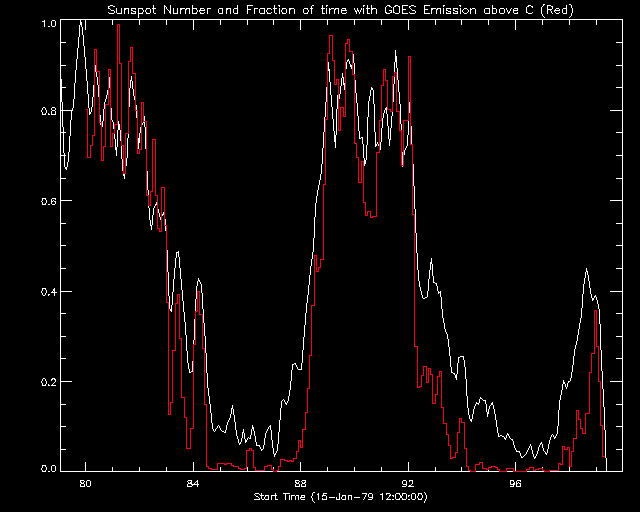
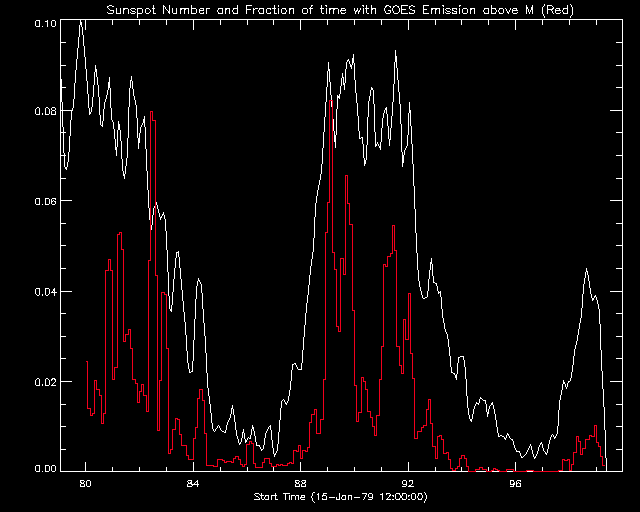
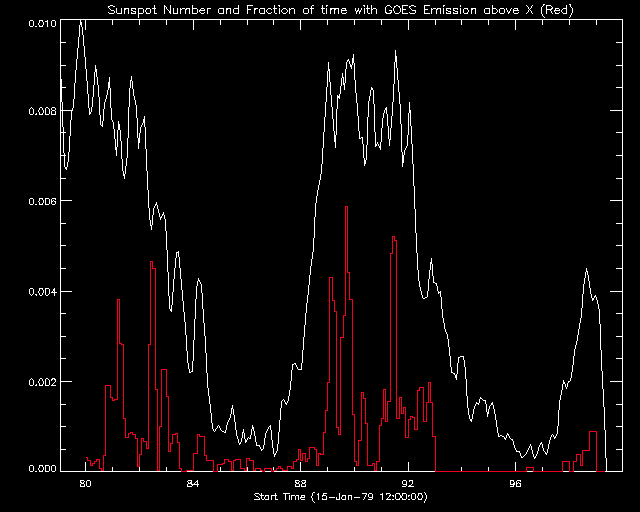
Here is a comparison of the sunspot number for cycles 21 & 22 with GOES X-ray data. What's plotted is the fraction of time in each month for which the GOES Xray level is above C, M and X. This is obtained using 5 minute averags of the GOES 1-8 A flux. For each month we simply count the number of 5 minute intervals which have a GOES flux above the given level, and divide by the total number of 5 min intervals for which GOES has data. This is then plotted along with the sunspot number for comparison.
Figure 1: C level

C level is the level of small flares, and also the X-ray background is often above C level during active times. So this is a measure of both flare activity and background level. For cycle 21, it peaks in 1981, about a 1.25 years after the sunspot number peak. (This may change when i get the all of the GOES data from 1979, but judging from the 1979 GOES flare list, which i *do* have, the peak will not be in 1979). For cycle 22, C level peaks along with the Sunspot Number.
Figure 2: M level

M level is the level of middle-sized solar flares, for cycle 21, these peak in 1982, 2.5 years after the Sunspot Number Peak. (This is the ``time lag'' observed in our ISEE-3 data). You don't see this in cycle 22, the Xray cycle is the same as the sunspot cycle.
Figure 3: X level

X level is the level of big solar flares. For cycle 21, just like M's, these peak in 1982, 2.5 years after the Sunspot Number Peak. Again, you don't see this in cycle 22.
Comments to: jimm@ssl.berkeley.edu