We present results from soft X-ray spectroscopy using RHESSI with multithermal models. Using the excellent spectral resolution of the RHESSI detectors we hope to answer the following questions: 1) Can we distinguish between thermal and nonthermal emission using only the spectral shape, without considering spatial variations? 2) Can we recover a meaningful differential emission measure for high temperature flare emission using only RHESSI data?
The Differential Emission Measure, or DEM, gives the amount of material in a thermal plasma as a function of temperature. In previous work, we have had success obtaining estimates of the Diffetential Emission Measure for solar flares using a combination of Yohkoh SXT, BCS and HXT data. (See, e.g., McTiernan, Fisher and Li 1999, Apj 514, 472.) There were two major conclusions drawn from this work. The first is that for flares, the DEM decreases with increasing temperature. This is not true for standard loop models, which have a DEM that increases to a cusp at the looptop temperature. The other main conclusion was that the Neupert Effect, i.e., the correlation of the derivative of the time profile in soft X-rays with the hard X-ray time profile, is more noticeable at high T than at low T. In this work we will not support or deny these conclusions; here we are simply testing the method to see if it can be used with RHESSI data.
A major issue when using RHESSI data is the presence of nonthermal emission. Here we take a flare in its soft X-ray decay phase and make the assumption that all of the excess emission is thermal. There is no way to rule out nonthermal emission (although we cannot obtain a good fit for the thermal plus nonthermal model, see the discussion for Figure 6). Future work will have to account for the presence of nonthermal emission, both for cases such as this one where there may be some small nonthermal component in the flare decay, and also for the earlier parts of the flare, in which the impulsive nonthermal emssion may extend down into to the 10 keV energy range.
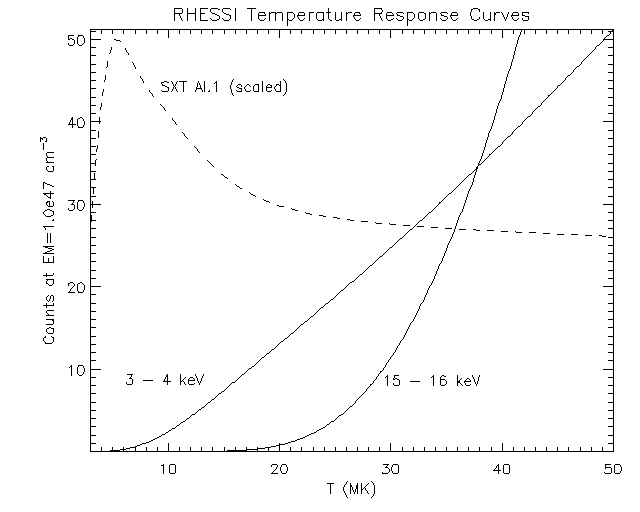
FIGURE 1: This is a plot of the T response for RHESSI for 3 - 4 keV and 15 - 16 keV. Note that this is a total response for detectors 1, 3, 4, 5, 6, and 9. The low energy channel responds to T as low as 4 MK, but has a much higher response at higher T. The higher energy channel has no response below about 18-20 MK; if you see counts in this channel, then there is some 18-20 MK plasma lurking somewhere. Or if you see no counts in this channel, then the maximum T is less than 18-20 MK. The differences in T response from channel to channel enables a DEM calculation, but it is not easy. A sample response curve from the YOHKOH SXT is also shown, note the differences, the SXT response has a peak in T, but the RHESSI response curves increase indefinitely. The DEM calculation for RHESSI is only possible because T has an upper limit.
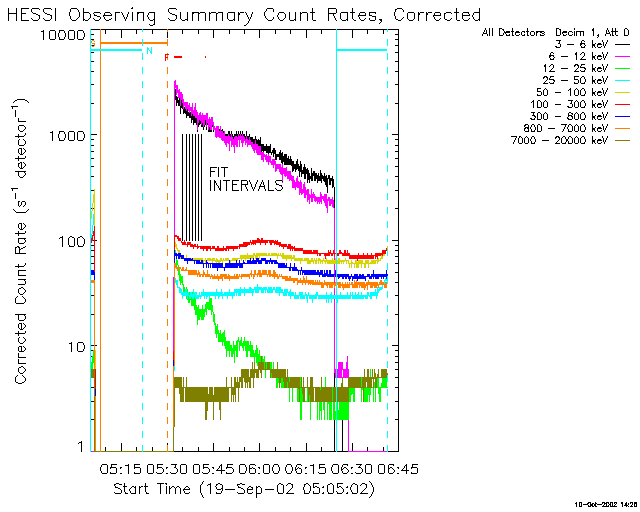
FIGURE 2: This is a plot of the RHESSI Observing Summary Count Rates for the decay phase of a flare on 19-sep-2002. The fit intervals were chosen to minimize the effect of non-thermal emission; this is 20 minutes after the soft X-ray peak (a C4.7 GOES event), any impulsive emission is gone. There are 5 one-minute intervals. We avoid the microflare that starts at 05:40 UT. There is nothing special about this flare, it was chosen because the author happened to be reprocessing data for 19-sep-2002 when the calculation was done.
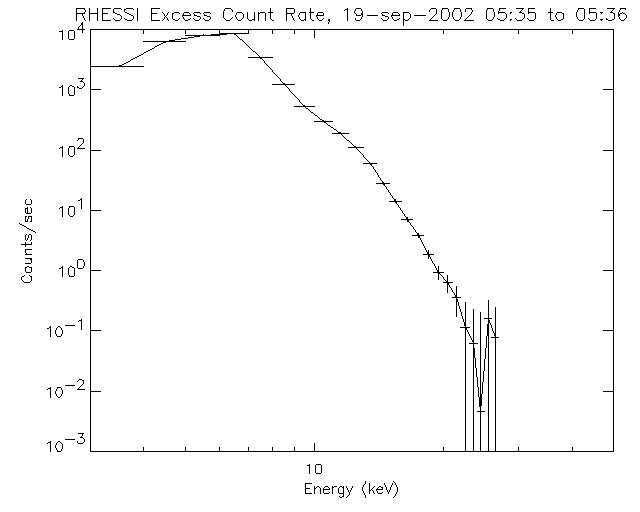
FIGURE 3: This is the background subtracted count rate spectrum for the interval 19-sep-2002 05:35 to 05:36 UT. This is summed over detectors 1, 3, 4, 5, 6, 9. The background was obtained from the time interval 1 day before the event, at the point where the spacecraft position was closest to the position for the fit interval. The Attenuators were open for both the background and fit intervals. The turnover in the count rate for low energy is due to absorption in passive material in front of the detectors, but not the attenuators. (Compare plots in "RHESSI Spectroscopy -- First Steps" by Brain Dennis .) The rates above 20 keV are insignificant, this gives us a maximum possible T of approximately 30 MK.
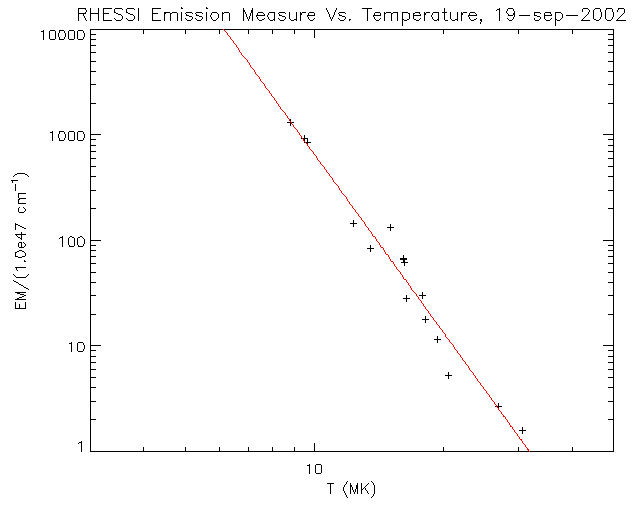
FIGURE 4: From N channels of data for a given time interval, we can obtain N-1 different measurements of T and EM, using channel ratios. These are plotted here. Low energy channels, which respond to low T plasma, give lower temperatures and higher emission measures than high energy channels. This is a characteristic of an Emission Measure distribution that decreases with increasing T. Here, the EM versus T dependence fits very nicely to a power law, which is shown by the red line on the plot. This power law is not the DEM, but it serves as the starting point in the DEM calculation.
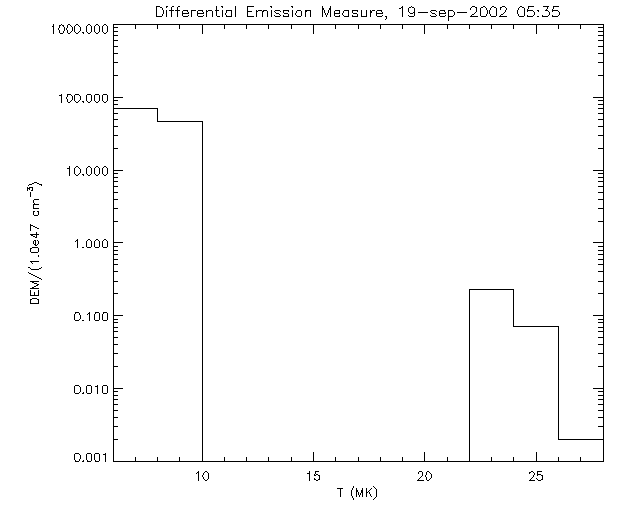
FIGURE 5: This is the DEM for the flare, in the interval 19-sep-2002 05:35 to 05:36 UT. This is a histogram-DEM as discussed in McTiernan, Fisher and Li (1999, Apj 514, 472.). The T range is divided into 2 MK bins from 6 MK to 30 MK, and an initial EM is assigned to each bin, determined by the power law taken from the previous figure. The final DEM is found by minimizing Chi-squared. The DEM has neatly resolved itself into two components, a large low T component, and a small high T component. This is behavior seen for approximately 10% of the Yohkoh flares analyzed by McTiernan, Fisher and Li. Most of the flares in that study showed a continuous DEM.
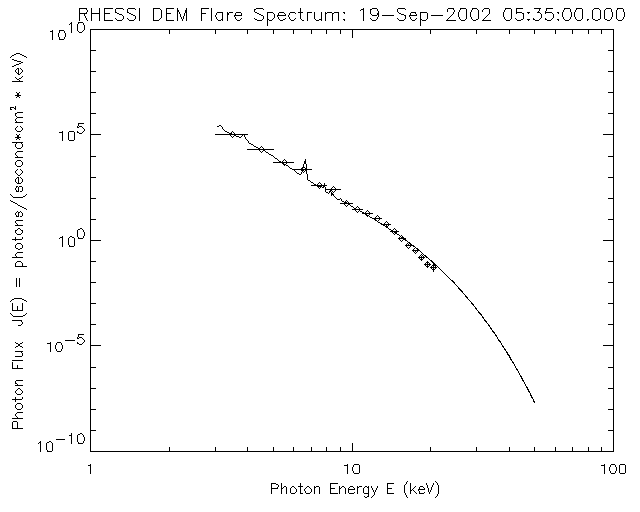
FIGURE 5: This is the photon spectrum obtained using the DEM for the flare, in the interval 19-sep-2002 05:35 to 05:36 UT. It turns out that the fit to the spectrum from the DEM is only marginally better than a straight fit to the spectrum of two thermal components, one at 8.5 MK and one at 22.8 MK. Also from the plot it looks as if this spectrum may be fit by a thermal component, plus a nonthermal broken power law component, with a spectral break at 12 keV. This thermal plus power law fit failed for this interval, however. Future work will have to account for the possibility of nonthermal emission in a self-consistent manner.
See Figures 1 -- 6.
The method worked, and a DEM was obtained for the flare. The DEM looks typical, in light of the results of the previous DEM results from Yohkoh. There is more emission measure at low T than at high T. It turns out that the DEM fits the data only marginally better than a model with two single T components, and we were unsuccessful in obtaining a thermal plus nonthermal fit. The initial answers to the questions posed in the abstract are 1) No and 2) Yes. It must be noted that this work is *very* preliminary, and future work may look much different.
Here are the plans for the future:
15-oct-2002, jmm