Revised, 21-Nov-1997
The contorversy about what slit-slat ratio to use in transmission calculations has been sort of resolved by Brian Dennis and Gordon Hurford. It's agreed that we should use a ratio of 55:45. The results are not very different from the previous versions.
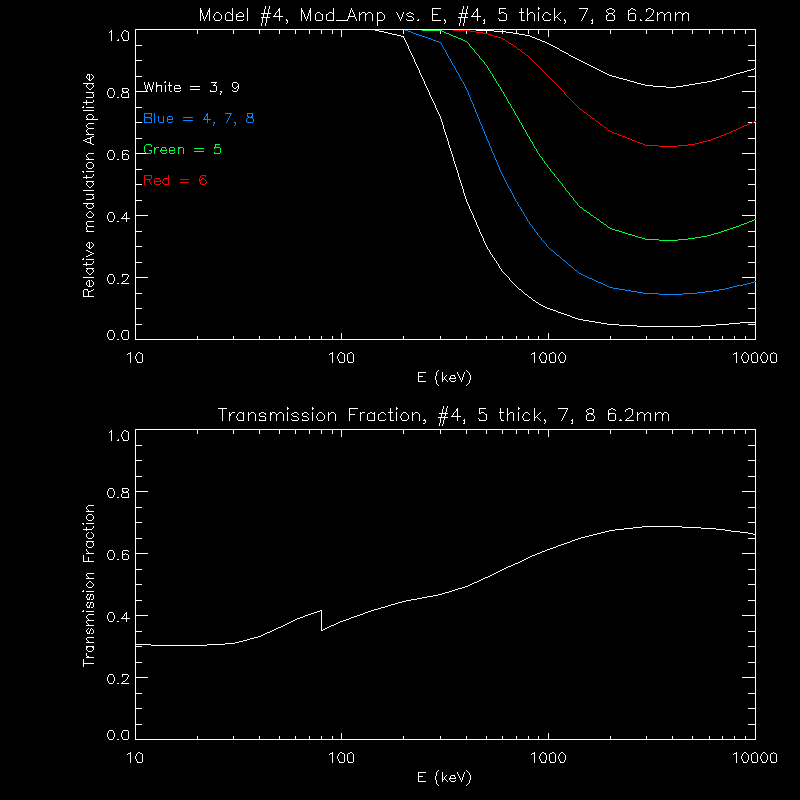
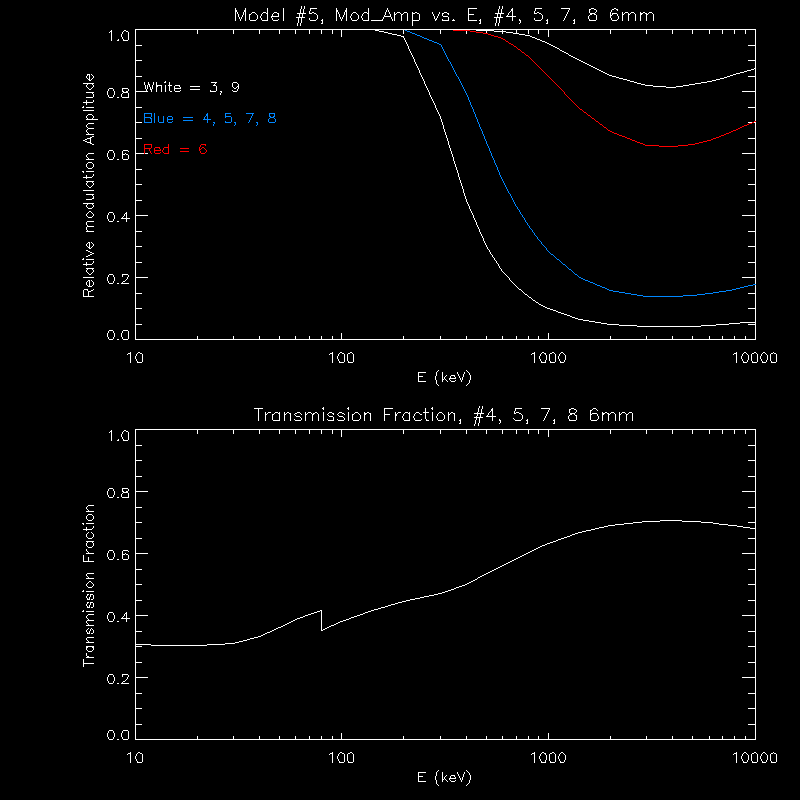
As before, Model #1 refers to the grid sizes and thicknesses given in the proposal: grids 1 and 2 have 0.055mm thickness, 3,4,5,7,8 are 3mm thick, 6 is 20 mm thick, and 9 is 30 mm thick. Model #2 has the grid thicknesses set so that grids 3,4,5, and 6 have 1 degree fields of view. Model #3 is the same as the proposed configuration, but with the thicknesses of 4 and 5 increased, to the max for a 1 degree field of view. Model #4 has the thicknesses of 4 and 5 increased to that for a 1 degee FOV, and 7 and 8 increased to 6.2 mm. Model #5 has 4, 5, 7, and 8 all having a thicknes of 6.0mm. The total mass in KG refers to one set of grids (note that the slit:slat ratio in the mass calculation is approximately 60:40,not 55:45 as in the transmission calculation, round grids are 9cm in diameter, with a 1cm ring around them of the slat material, square grids are 9cm in width, with a 1cmX1cm thick steel frame).
| Grid | #1 | #2 | #3 | #4 | #5 | #6 | #7 | #8 | #9 | Total Mass (kg) |
|---|---|---|---|---|---|---|---|---|---|---|
| Model #1 | 0.055 | 0.055 | 3.00 | 3.00 | 3.00 | 20.00 | 3.00 | 3.00 | 30.00 | 7.41 |
| Model #2 | 0.055 | 0.055 | 3.60 | 6.20 | 10.70 | 18.60 | 30.00 | 30.00 | 30.00 | 12.76 |
| Model #3 | 0.055 | 0.055 | 3.00 | 6.20 | 10.70 | 20.00 | 3.00 | 3.00 | 30.00 | 8.07 |
| Model #4 | 0.055 | 0.055 | 3.00 | 6.20 | 10.70 | 20.00 | 6.20 | 6.20 | 30.00 | 8.63 |
| Model #5 | 0.055 | 0.055 | 3.00 | 6.00 | 6.00 | 20.00 | 6.00 | 6.00 | 30.00 | 8.30 |
The transmission fraction is fraction of the incident photons that can be expected to get through the collimators to the detectors. For perfectly opaque slats, and a slit-slat ratio of 55:45, the fraction is 0.33 (0.36 for a slit-slat ratio of 60:40, 0.25 for a ratio of 50:50). This number here is averaged over all of the detectors; since grids 1 and 2 are effectively transparent at these high energies, the fraction is pretty large.
| E(keV) | 511.000 | 1000.00 | 2200.00 |
|---|---|---|---|
| Model #1 | 0.608 | 0.703 | 0.755 |
| Model #2 | 0.499 | 0.555 | 0.604 |
| Model #3 | 0.564 | 0.652 | 0.709 |
| Model #4 | 0.528 | 0.615 | 0.678 |
| Model #5 | 0.539 | 0.633 | 0.696 |
[Note that the previous versions went up to 7 MeV. The 7 MeV was dropped because the numbers were almost the same as for 2.2 MeV. The full range from 10 keV to 10 MeV is included in the plots.]
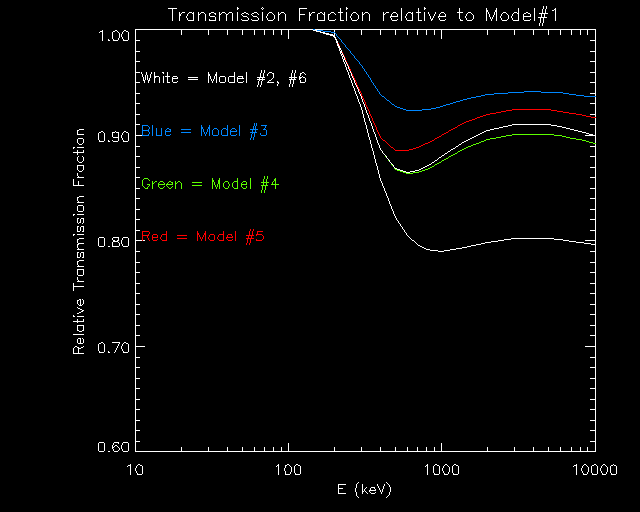
For the most extreme case, Model #2, the sensitivity will be decreased by about 18 to 21% over the 500 keV to 2.2 MeV range. For the least extreme case, Model, #3, there is a 6 to 7% decrease. The other two cases are somewhere in between. Here's the transmission relative to the baseline model (#1).
| E(keV) | 511.000 | 1000.00 | 2200.00 |
|---|---|---|---|
| Model #1 | 1.000 | 1.000 | 1.000 |
| Model #2 | 0.820 | 0.790 | 0.800 |
| Model #3 | 0.927 | 0.928 | 0.939 |
| Model #4 | 0.868 | 0.875 | 0.897 |
| Model #5 | 0.886 | 0.900 | 0.921 |
Here is a plot of the relative transmission fractions, as a function of energy

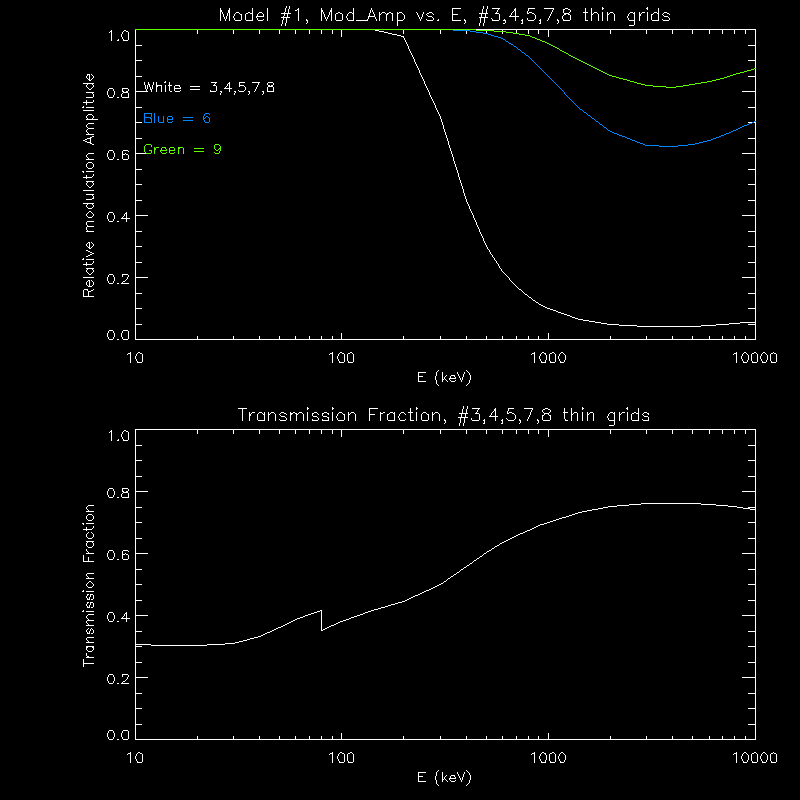
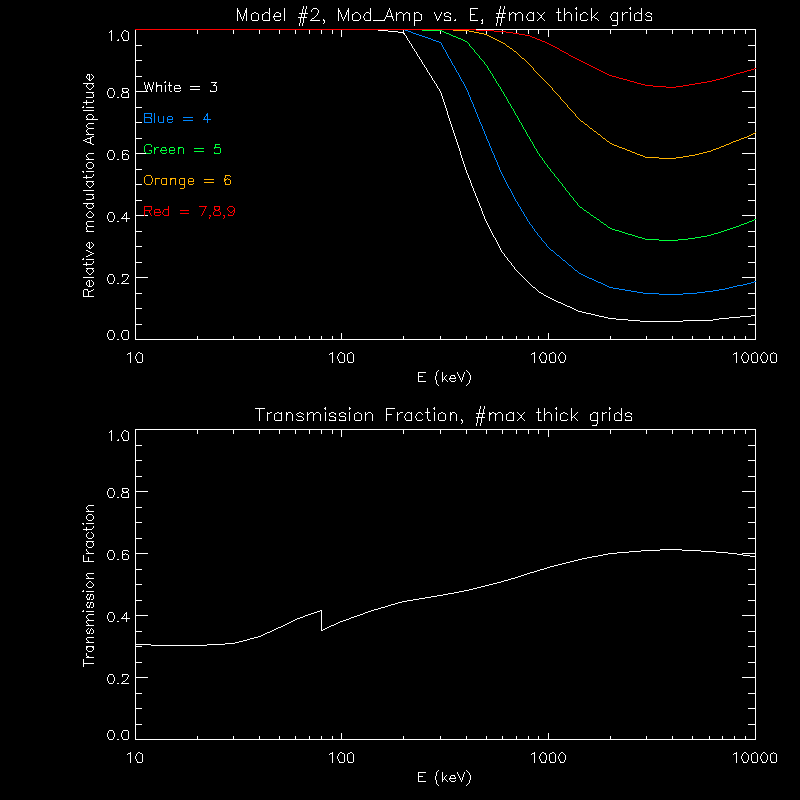
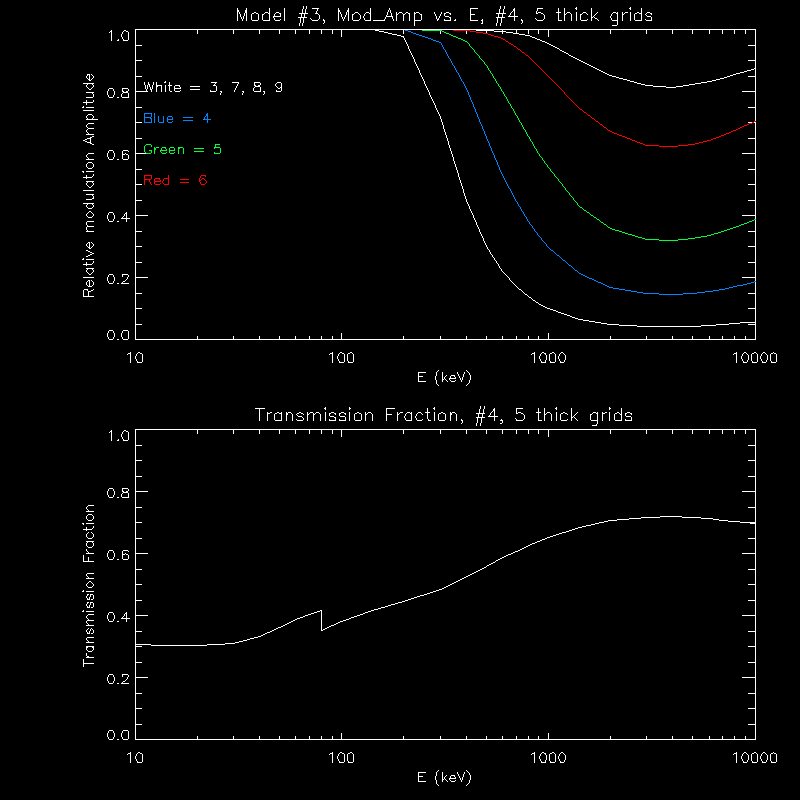
Here is the effect on the relative modulation amplitude at 511, 1000, 2200, and keV for each model. Remember, thick grids mean higher modulation amplitude, and better imaging.
| Grid | #1 | #2 | #3 | #4 | #5 | #6 | #7 | #8 | #9 |
|---|---|---|---|---|---|---|---|---|---|
| Model #1 | 0.000 | 0.000 | 0.292 | 0.292 | 0.292 | 0.988 | 0.292 | 0.292 | 0.999 |
| Model #2 | 0.000 | 0.000 | 0.368 | 0.638 | 0.877 | 0.983 | 0.999 | 0.999 | 0.999 |
| Model #3 | 0.000 | 0.000 | 0.292 | 0.638 | 0.877 | 0.988 | 0.292 | 0.292 | 0.999 |
| Model #4 | 0.000 | 0.000 | 0.292 | 0.638 | 0.877 | 0.988 | 0.638 | 0.638 | 0.999 |
| Model #5 | 0.000 | 0.000 | 0.292 | 0.622 | 0.622 | 0.988 | 0.622 | 0.622 | 0.999 |
| Grid | #1 | #2 | #3 | #4 | #5 | #6 | #7 | #8 | #9 |
|---|---|---|---|---|---|---|---|---|---|
| Model #1 | 0.000 | 0.000 | 0.101 | 0.101 | 0.101 | 0.851 | 0.101 | 0.101 | 0.957 |
| Model #2 | 0.000 | 0.000 | 0.136 | 0.299 | 0.555 | 0.823 | 0.957 | 0.957 | 0.957 |
| Model #3 | 0.000 | 0.000 | 0.101 | 0.299 | 0.555 | 0.851 | 0.101 | 0.101 | 0.957 |
| Model #4 | 0.000 | 0.000 | 0.101 | 0.299 | 0.555 | 0.851 | 0.299 | 0.299 | 0.957 |
| Model #5 | 0.000 | 0.000 | 0.101 | 0.287 | 0.287 | 0.851 | 0.287 | 0.287 | 0.957 |
| Grid | #1 | #2 | #3 | #4 | #5 | #6 | #7 | #8 | #9 |
|---|---|---|---|---|---|---|---|---|---|
| Model #1 | 0.000 | 0.000 | 0.049 | 0.049 | 0.049 | 0.661 | 0.049 | 0.049 | 0.844 |
| Model #2 | 0.000 | 0.000 | 0.068 | 0.164 | 0.352 | 0.624 | 0.844 | 0.844 | 0.844 |
| Model #3 | 0.000 | 0.000 | 0.049 | 0.164 | 0.352 | 0.661 | 0.049 | 0.049 | 0.844 |
| Model #4 | 0.000 | 0.000 | 0.049 | 0.164 | 0.352 | 0.661 | 0.164 | 0.164 | 0.844 |
| Model #5 | 0.000 | 0.000 | 0.049 | 0.156 | 0.156 | 0.661 | 0.156 | 0.156 | 0.844 |
It looks like Models 2, 4, and 5 will give reasonable imaging at 511 keV, the only way to get good imaging at higher energies will be to make all of the grids as thick as possible.
Here are plots for the modulation amplitude and transmission fraction for each model.
Comments to: jimm@ssl.berkeley.edu