This document describes the HESSI data analysis software package. All routines are coded in IDL, level 5.0 or above. It is assumed that this will be part of the Solar Software package (SSW, see http://www.space.lockheed.com/EIT/ssw_setup.html) , thus the routines will make use of the general routines already contained in SSW.
In order to retain maximum flexibility, the system is constructed in a "bottom-up" fashion, i.e, the first routines to be defined and constructed are the lowset level routines for data access manipulation and display. Higher level routines will be constructed using these routines as building blocks.
This document, however, is intended to guide the user through the software from the "top-down", with the highest level routines described first, following the path of the data through the system. We intend to have one high-level routine for each major HESSI task, e.g., for all imaging, there is a routine called HESSI_IMAGE, which will give the user all of the available options for different imaging algorithms. The user will only need to remember a few program names when in a HESSI analysis session.
i) Task Levels
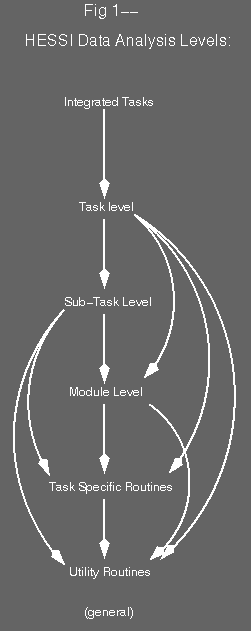
The different programs are ordered as follows: The highest level is called the Integrated Task level; these are programs designed to to multiple HESSI tasks (such as imaging plus spectroscopy). The next level is the Task Level; these are routines designed to do one specific HESSI task (such as imaging or spectroscopy). Task level routines are called by integrated task level routines, but will not generally be called by other task level or lower routines. It is expected that most of the users of HESSI data will call the routines at the integrated task or task level. The next level down is the Sub-task level; sub-tasks are routines used by tasks and integrated tasks, but which also should be expected to be used alone in a data analysis session. The next level down is the Module level; module level routines are used by higher level routines, and are expected to be used alone rarely. Below the module level is the Utility level; these are general routines that are the building blocks of the higher-level routines. Each task and sub-task will also have specialized utilities, which will reside in the same directory as the upper level routines for that task. A diagram of how the system is organized is shown in Figure 1. Note that the sense of the arrows between levels is downwards; the arrow points from the task or routine that calls the one at which the arrow points to. It is specifically forbidden only for the general utility routines to call any task-specific routine. Every other level to level call will be allowed.

A diagram of the individual integrated tasks, tasks, sub tasks, modules and other routines is provided in Figure 2, As in Figure 1, the arrows point away from the calling routine/task. For the second and third parts of Figure 2, which show the utiliity and task-specific routines, and other tasks, the arrows have been dispensed with, to avoid too much clutter. The individual software elements are described in the next sections.
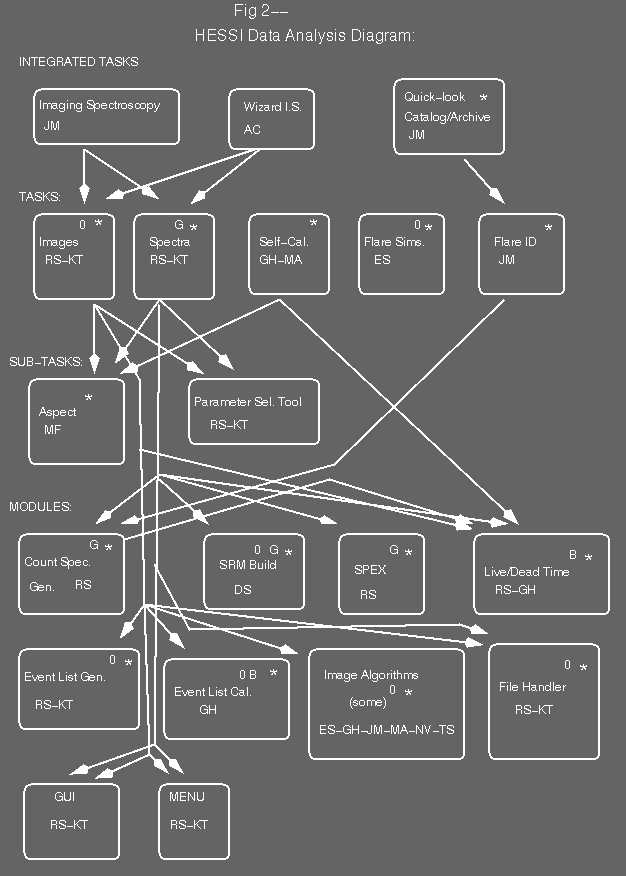
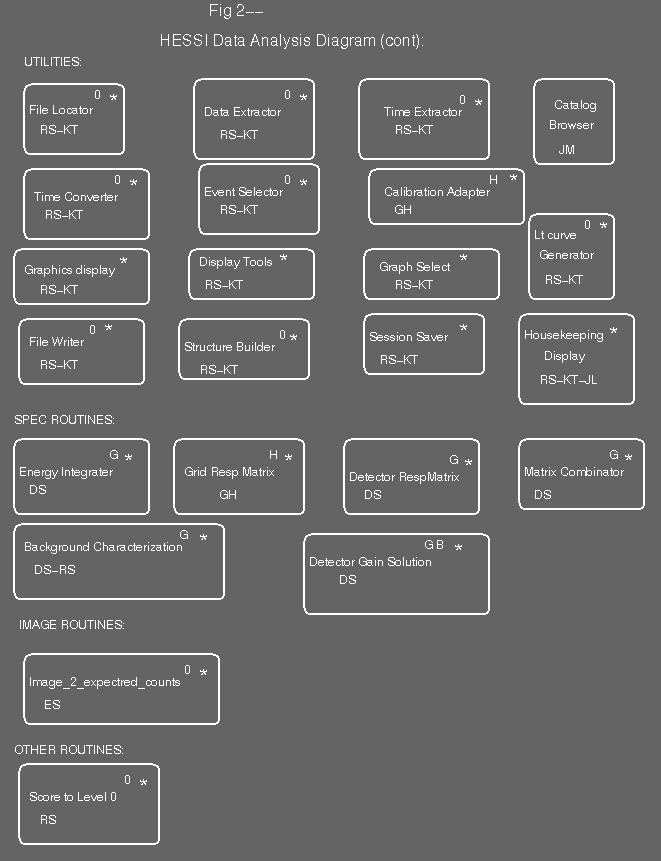
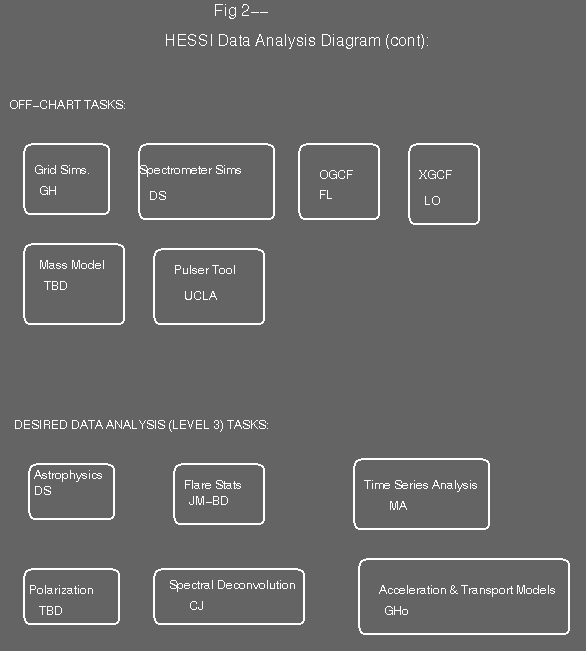
In Figure 2, each SW element has annotations. The annotations above denote schedule milestones; a preliminary version is expected to be working by the appropriate time, e.g., those elements marked with ``0'' are to be part of Release 0, scheduled for 14-sep-1998, for test purposes. The milestones at present:
0 - Release 0, 14-sep-1998
A - Grid Delivery to GSFC begins Jan-1999
B - IDPU test (no detectors), 1-jan-1999
C - Grid Delivery to PSI
D - Flight Spectrometer testing, 7-apr-1999
E - Spectrometer Source Test, Jul-1999
G - IDPU plus Spectrometer test
H - Mission Integration and Test, 1-jan-2000
* - Launch, jul-2000
The annotations below each element in the box are the initials of the people who are expected to be responsible for those elements, or at least have expressed some interest in generating software for those elements. If you see your name, and didn't know about this, send mail. The initials (in no particular order):
JM - J. McTiernan
RS - R. Schwartz
KT - K. Tolbert
AC - A. Csillaghy
GH - G. Hurford
ES - E. Schmahl
MA - M. Aschwanden
DS - D. Smith
JL - J. Loran
FL - F. Lang
LO - L. Orwig
UCLA - Somebody as yet undetermined at UCLA
CJ - C. Johns-Krull
GHo - G. Holman
BD - B. Dennis
MF - Martin Fivian
iii) The HESSI SW Tree
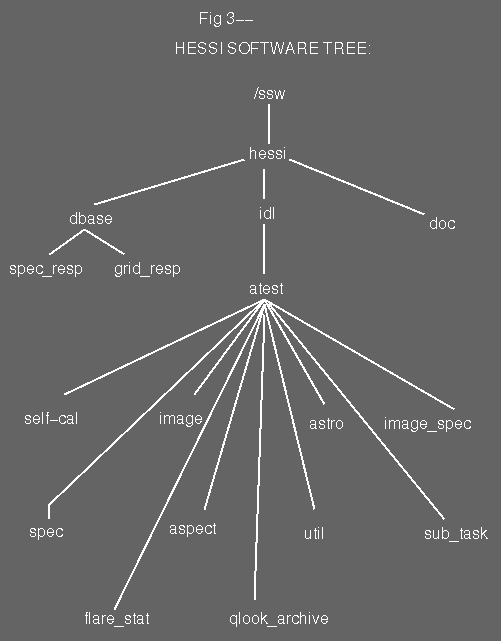
The HESSI software tree is shown in Figure 3. The routines will reside in /ssw/hessi/idl, which will have a subdirectory for the programs for each task, integrated task, and sub-task, under a directory called atest, for new software. There will be a directory /ssw/hessi/dbase for the spectral and grid responses.
iv) The HESSI SOC data flow diagram
The HESSI SOC data flow diagram, as shown in Figure 4, is relatively simple. In the figure, data products are enclosed in ellipses, software is enclosed in rectangles with rounded corners and hardware and database systems are enclosed in rectangles with square corners.
VC1 (spacecraft housekeeping) and VC3 (event list) telemetry packets are saved in files, with the naming convention vc_yyyymmddhhmmss where the given time is time for the contact initiation. Vc2 (real time science) data is passed to a workstation for display, and then discarded. (All of the vc2 packets are assumed to be a subset of the vc3 data). The archived data will be reorganized into smaller files, each corresponding to 1 orbits worth of data, with the naming convention vc_yyyymmdd.hhmm, where the time will refer to UT for the first packet of the orbit. Orbital files which are larger than 100Mb will be broken into smaller files of 100Mb or less (this should only happen for very large flares, during times when the shutters are open). The archived data will then be passed into the Quick-look/Archiving program on the SOC ARCHIVE workstation for catalog generation. Archived data, and the flare catalog for the time interval of the archived data will be pressed onto CD's for distribution and inclusion into the local UCB HESSI database. The flare catalog for the entire mission will be kept online on a SOC workstation, available for browsing. The archived data and event catalog will be sent to the NASA SDAC, and to ETH and made available to the public.
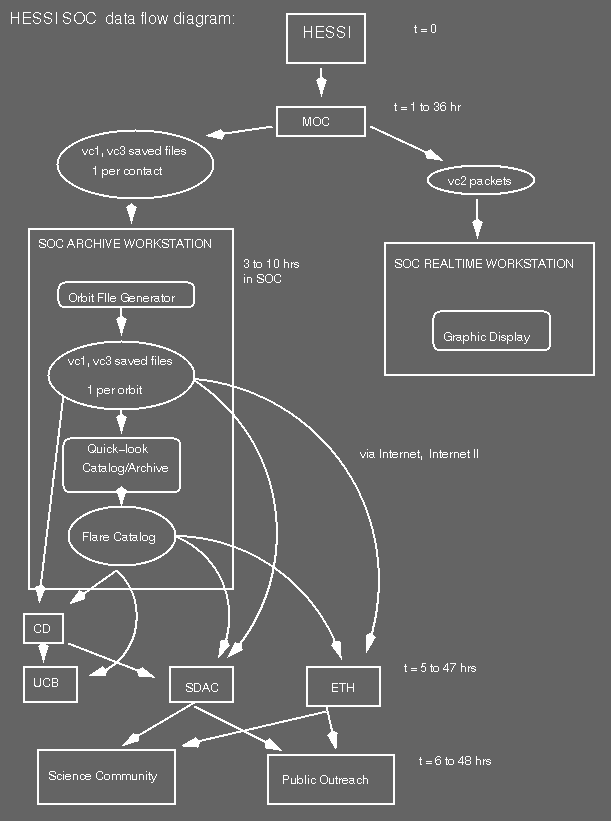
The times shown in Figure 4 are estimated elapsed times up to the completion of each step. Typically, the MOC will receive data some 1 to 35 hours after it is collected; the higher number is for operations with the low energy attenuator shutter open, in this case the memory is typically 3/4 full, and there will be a 34 hour delay in obtaining recorded data. The SOC will take approximately 3 to 10 hours to store and write the data from a given contact, and generate the flare catalog. It is expected that the data can be transferred to SDAC and ETH, over the Internet and/or Internet II in an hour (estimated for 1 Gb of data), the data should be available to the public in 6 to 48 hours, depending on the memory status.
i) Imaging spectroscopy
NAME: Hessi_spec_image
PURPOSE: Obtains images, then uses the images to obtain spatially resolved energy spectra.
INPUT: Level 0 data, or a set of images, time intervals, energy ranges, Aspect data or solution, grid model data
OUTPUT: Spatially resolved photon spectra
ii) Wizard I.S. (Imaging-Spectroscopy)
NAME: Hessi_wizard
PURPOSE: An interactive, user friendly tool for creating HESSI images and spectra
INPUT: None explicit, Users will determine this in the session
OUTPUT: Images and Energy Spectra
iii) Automated Quick Look/Archiving
NAME: Auto_quick_look
PURPOSE: From level 0 data, creates light curves and flare catalog
INPUT: Level 0 data, event lists, Aspect data, housekeeping data
OUTPUT: Light curves in N energy bands and the flare catalog, which includes start, peak, and end times for events, background intervals for each event, flare position, peak size in N energy bands, low energy resolution spectra, low spatial resolution images in N energy bands. Flags: Spacecraft night, SAA flags, shutter status.
i) Imaging
NAME: Hessi_Image
PURPOSE: Images, using various algorithms
INPUT: event lists, aspect data or solutions, grid model data, time intervals, energy bands, image algorithm identifier, image control parameters All inputs can be selected interactively or passed in.
OUTPUT: images.
ii) Spectroscopy
NAME: Hessi_spectrum
PURPOSE: Energy spectra
INPUT: event lists, aspect data or solutions, detector and grid response data or full response matrix, time intervals, energy bands, background intervals or spectra, spectral model identifier, spectral control parameters. All inputs can be selected interactively or passed in.
OUTPUT: Energy spectra
iii) Self-Calibration
NAME: Hessi_self_cal
PURPOSE: To obtain grid model parameters using in-orbit calibration.
INPUT: Flare data, aspect data or solutions for many flares
OUTPUT: Grid Model Parameters to be used in imaging
iv) Flare Identification:
NAME: Hessi_flare_id
PURPOSE: Automated, Finds flares by inspection of light curves.
INPUT: Light Curves in Different energy bands, time array for light curves, flags for Spacecraft night-SAA passage-Bad data, energy bands for the light curves.
OUTPUT: number of flares found, flare start, peak and end times, in different energy bands, peak count rate in different energy bands for each flare, suggested background interval times for each flare
v) Flare Simulation
NAME: Hessi_model_2_score
PRUPOSE: takes simulated images, generates simulated event lists.
INPUT: sets of images, with different time and spectral dependences, Simulated aspect data or solutions, grid model data
OUTPUT: Simulated event lists
i) Flare Statistical Analysis
NAME: Hessi_flare_stats
PURPOSE: Reads flare catalog, generates statistics, such as size distributions in counts, duration, and spectral parameters.
INPUT: HESSI flare catalog
OUTPUT: size and spectral distributions
ii) Time Series Analysis
NAME: Hessi_time_series_anal
PURPOSE: Time series analysis of hessi spectrometer data
INPUT: event lists, or count rate data
OUTPUT: TBD
iii) Astrophysical Applications
TBD.
iv) Polarization
TBD.
v) Electron Spectral Deconvolution
TBD.
vi) Acceleration & Transport Models
TBD.
i) Aspect Solution
NAME: Hessi_aspect_solution
PURPOSE: Finds the direction in which the spacecraft is pointing at a given time.
INPUT: the time (or times) for the solution, the RAS and SAS data, the position of the spacecraft, ephemeris data for the sun.
OUTPUT: The position of the center of the sun, with respect to the axis of rotation.
ii) Parameter Selection Tool
NAME: Hessi_parameter_sel
PURPOSE: A routine which can be used to select the parameters used to run a given HESSI task. Parameters can be passed in or chosen interactively.
INPUT: event lists or light curves in different energy bands, time intervals, energy bands, background intervals or spectra, task_id, image algorithm identifier, image control parameters, spectral model identifier, spectral control parameters.
All inputs can be selected interactively or passed in.
OUTPUT: time intervals, energy bands, background intervals or spectra, task_id, image algorithm identifier, image control parameters, spectral model identifier, spectral control parameters
i) Live/Dead Time
NAME: Hessi_dead_time
PURPOSE: Find dead time
INPUT: event list
OUTPUT: Dead time, as a fraction of the total time input, or in seconds
ii) Menu Interface
NAME: Hessi_menu
PURPOSE: A simple interactive Menu interface to handle Hessi tasks
INPUT: None explicit, the user is prompted for commands
OUTPUT: None explicit
iii) GUI Interface
NAME: Hessi_menu
PURPOSE: A GUI interface to handle Hessi tasks
INPUT: None explicit
OUTPUT: None explicit
iv) File Handler
NAME: Hessi_file_handler
PURPOSE: Handles File IO for Hessi, finds or creates the appropriate files then inputs or outputs, also deletes temporary files
INPUT: File type, input-output flag, append flag, temporary/permanent flag, filename, output data if applicable
OUTPUT: input data if applicable
v) Count Spectrum Generator
NAME: Hessi_count_spec_gen
PURPOSE: Provides counts spectra for use in spectral fitting, incorporating gain and dead time corrections
INPUT: event lists, time intervals, energy bands, energy bins
OUTPUT: count spectra
vi) SRM Builder
NAME: Hessi_build_srm
PURPOSE: Provides spectral response matrix (SRM) for use in spectral fitting
INPUT: energy bands, energy bins, detector response data, grid response data, aspect solution or data
OUTPUT: The differential response matrix
vii) SPEX (Enhanced SPEX)
NAME: SPEX
PURPOSE: Spectral fitting
INPUT: count rates and SRM for given energy bands and intervals, spectral model identifier, spectral control parameters
OUTPUT: Photon spectra
viii) Event List Generator
PURPOSE: Obtains an event list from Level 0 data for given energy bands
INPUT: Level 0 data, time intervals, energy bands
OUTPUT: Event list
ix) Event List Calibrator
PURPOSE: Calibrates an event list, incorporating aspect solution, dead time correction, gain calibration, for input into image algorithms.
INPUT: event list, time intervals, energy bands, aspect data or solution.
OUTPUT: Calibrated Event list
x) Imaging Algorithms
These will be instrument-independent algorithms; in principle, the appropriate data from any detector can be passed in, and an image is returned
NAME: Full_Sun_Mapper
PURPOSE: Full Sun maps
INPUT: calibrated event list, grid model parameters, Aspect Solution, image control parameters
OUTPUT: Images
NAME: MEM_image
PURPOSE: Maximum Entropy Method imaging
INPUT: calibrated event list, grid model parameters, Aspect Solution, image control parameters
OUTPUT: Images
NAME: PIXON_image
PURPOSE: Pixon method imaging
INPUT: calibrated event list, grid model parameters, Aspect Solution, image control parameters
OUTPUT: Images
NAME: Fourier_image
PURPOSE: Inverse Fourier imaging
INPUT: calibrated event list, grid model parameters, Aspect Solution, image control parameters
OUTPUT: Images
NAME: Clean_image
PURPOSE: Clean algorithm imaging
INPUT: calibrated event list, grid model parameters, Aspect Solution, image control parameters
OUTPUT: Images
NAME: Forward_model_image
PURPOSE: Forward modeling image
INPUT: calibrated event list, grid model parameters, Aspect Solution, image control parameters
OUTPUT: Images
NAME: Back_projection_image
PURPOSE: Imaging be back projection
INPUT: calibrated event list, grid model parameters, Aspect Solution, image control parameters
OUTPUT: Images
NAME: Spatial_spectral_image
PURPOSE: Spatial and spectral imaing together
INPUT: calibrated event list, grid model parameters, Aspect Solution, image control parameters, SRM, energy bins, energy bands
OUTPUT: Images
NAME: Catalog_Browser
PURPOSE: search flare catalog and obtain events
INPUT: time intervals to search for data, event size and duration thresholds, Spectral parameter limits. Can be interactive
OUTPUT: flare catalog entries for the events found, includes start, peak, and end times for events, background time intervals for each event, flare position, peak size in N energy bands, low energy resolution spectra, low resolution images in N energy bands,
NAME: File_Locator
PURPOSE: Given time and data type, find the file to be read
INPUT: the time interval for the data desired, the type of file to be searched for.
OUTPUT: the file(s) which contain the data, a roadmap that points to the data in the individual files.
NAME: Data_Extractor
PURPOSE: Extracts data from individual files
INPUT: the file(s) which contain the data, and the roadmap that points to the data in the individual files.
OUTPUT: the data (format:TBD)
NAME: Time_Extractor
PURPOSE:
INPUT: Telemetry Packet(s) or Packet_pointer
OUTPUT: Time associated with every Telem Word in the Packet(s)
NAME: Time_Converter
PURPOSE:
INPUT: Telemetry Packet(s) or Packet_pointer
OUTPUT: Time associated with every Telem Word in the Packet(s)
NAME: EVENT_SELECTOR
INPUT: Telemetry Packet(s), Time Window Constraints, Detector Mask, Segment Mask, Coincidence Mask, Energy Range.
OUTPUT: Indices of valid structures.
NAME: CALIBRATION_ADAPTOR
INPUT: Time range, calibration file type (Grid Trans, Grid Phase, Grid Amplitude, Shutter Trans, Detector Response, detector mask, segment mask, coincidence flags,...), Grid Axis definition.
OUTPUT: Indicated calibration(s) integrated and interpolated as needed to defined axes.
NAME: GRAPHICS_DISPLAY
INPUT: Data Arrays, 1, 2, (or 3d), Axis Scale (e.g. Time vectors for light curves, Energy Vectors for spectra, angular spacing along image axes, titles, sub-titles, legends, extras), Type (light curve, spectra, image). Data selection requests.
OUTPUT: Screen graphics and Graphics Files. Range of selected data.
NAME: Display tools
PURPOSE: Various tools Used by the Graphics Display
INPUT: TBD
OUTPUT: TBD
NAME: Graph Select
PURPOSE: Graphic Selection tool
INPUT: TBD
OUTPUT: TBD
NAME: Lt_curve_generator
PURPOSE: Takes an event list, and produces light curves, for a given time resolution, for each collimator, or for a set of collimators
INPUT: event list, time resolution, energy bands
OUTPUT: light curves
NAME: File_Writer
PURPOSE: Writes data to files
INPUT: data, data type, filenames can be set
OUTPUT: files are written, filenames are returned
NAME: Structure_Builder
PURPOSE: Builds Hessi index and data structures
INPUT: data type
OUTPUT: structure
NAME: Session_Saver
PURPOSE: Saves HESSI analysis session
INPUT: variable names for items to be saved, or /ALL
OUTPUT: IDL save file with appropriate variables
NAME: Housekeeping Display
PURPOSE: Display Housekeeping data
INPUT: Vc1 telemetry packets
OUTPUT: Displays HK data
NAME: Energy_integrater
PURPOSE: Gain Corrects and bins events into count spectra
INPUT: event list, energy bins
OUTPUT: binned, gain corrected, count spectra
NAME: Grid_response_matrix_gen
PURPOSE: Finds the response matrix of the grids
INPUT: grid model parameters and aspect solution, energy bins
OUTPUT: The Grid response matrix
NAME: Detector_response_matrix_gen
PURPOSE: Finds the response matrix of the detectors
INPUT: detector calibration data, energy bins
OUTPUT: The Detector response matrix
NAME: Matrix_combinator
PURPOSE: Folds the Grid and detector responses together
INPUT: Grid and detector response matirces
OUTPUT: The total spectral response matrix (SRM)
NAME: Background_char
PURPOSE: Characterizes the background, obtains background spectrum
INPUT: event list, energy bands, Background time intervals
OUTPUT: background spectra
NAME: Detector_Gain_solution
PURPOSE: Otain the energy vs. channel relation for the detectors from the gain
INPUT: Detector calibration data, time intervals(?)
OUTPUT: energy vs. channel relation for the detectors
NAME: Image_2_expected_counts
PURPOSE: Given a trial image, obtain the expected counts in each detector
INPUT: image, modulation pattern info
OUTPUT: the expected number of counts from the input image
Includes specialized Self-calibration routines, and routines used for time series analysis, flare statistics, astrophysical, polarization, and other desired data analysis tasks.
NAME: Score_to_level_0
PURPOSE: Generates a level 0 event list from a series of images at different times an energies
INPUT: images, image times and photon energies
OUTPUT: level 0 data, ideal for testing.
i) Grid Simulations
TBD
ii) Spectrometer Simulations
TBD
iii) XGCF (Xray Grid Characterization Facility)
TBD
iv) OGCF (Optical Grid Characterization Facility)
TBD
v) Pulser Tool
TBD
vi) Mass Model
TBD
Comments to: jimm@ssl.berkeley.edu