ND_DEMO

By J.McTiernan

Hi, welcome to ND_DEMO, hopefully this will illustrate some of the effects of the ND (Neutral Density) filter, and exposure times on SXT flare images. If you're not familiar with the SXT, you should go to the YOHKOH SXT page at Lockheed, and read up. If you want to go directly to the Conclusions feel free.

All of the plots and images will refer to a flare which occurred on 7-Jan-1992, at approximately 20:22 UT. Only Al.1 images have been used; 7-Jan-1992 is a useful flare for this study because of the last 18 Al.1 images. For these images the exposures alternate between ND filter images with MBE=4, with exposure times of about 3.1 msec and OPEN images with MBE=1, with exposure times of about 2.9 msec. It is important to be sure that when comparing ND and non-ND images that the effective exposure times are similar--there are exposure time effects that are more noticeable than the ND filter effects, we'll get into that later.

PART 1) ND FILTER EFFECTS:

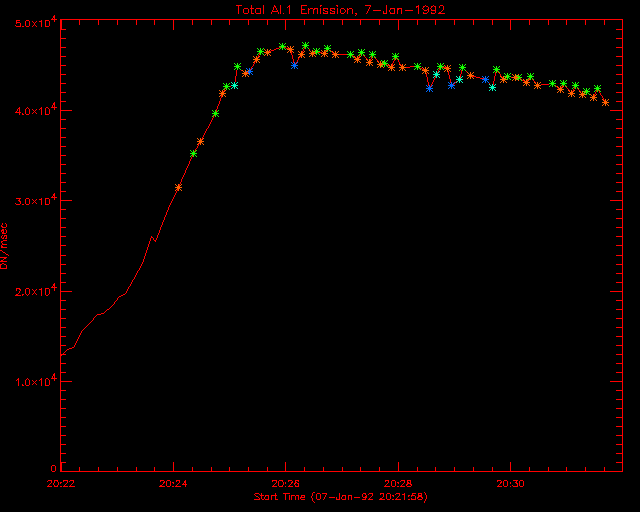
The first plot, Figure 1, is a time plot of the background-subtracted total emission in units of DN/msec, (DN is the Data Number, a measure of the brightness) summed over the whole image. There's some variation, due to the ND filter, and due to the above-mentioned exposure time effects. The stars at various points denote different exposure levels. The dark blue ones are the shortest exposures, no-ND filter and MBE level 0, and exposure time of about 0.95 msec, the lighter blue ones are ND-fliter images with MBE=2, and exposure times of 1.4 msec. The green stars are the non-ND images with MBE=1, and 2.9 msec exposures, and the orange stars are the ND images with MBE=4, and exposure times of 3.1 msec. A couple of things should be noted; 1) the 2.9 msec exposures are slightly higher than the 3.1 msec ND exposures; this can be attributed to the ND filter, and 2) the 0.95 msec exposures are lower than the rest; this is an effect of the shorter exposure time.

Figure 1: Total Al.1 emission for the 7-jan-1992 flare versus time.
See text


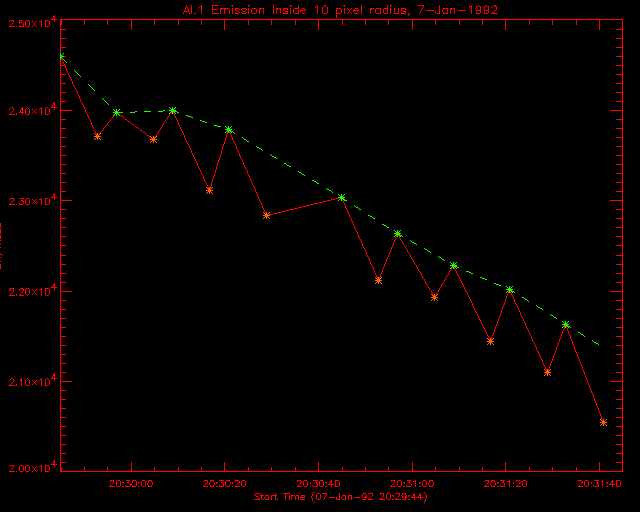
Figure 2 illustrates the ND filter effects. For this i'll use the 'radial profile', A(r), which is defined as the amount of emission inside a circular region, of radius r (in pixels) around the maximum. This plot is for the radial profile for region of r=10, for the last 18 images, which alternate between ND and OPEN filter configurations. The red line with the shows the actual values of A(10), while the dashed green line gives the values of A(10) interpolated using only the non-ND images. The positions of the ND images are shown by orange stars, and the non-ND images are shown by green stars. As you can see, there is less emission in the ND filter images. The average fractional shortfall for the ND images is: 0.027

Figure 2: The Emission within a 10 pixel radius of the maximum brightness versus time, for 7-jan-1992.
See text


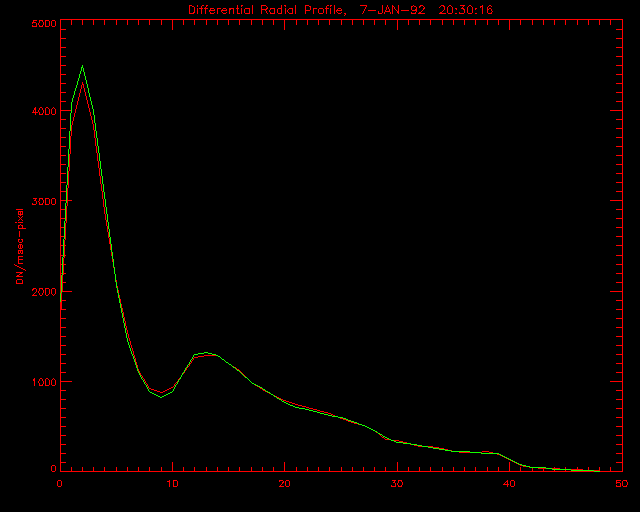
This next plot, Figure 3, shows dA(r) = A(r)-A(r-1), the differential radial profile, which gives a measure of the width of the image. The quantity dA(r) gives the amount of emission into a 1 pixel wide ring at radius r. This has not been normalized by the area of the ring. The red line shows the true profile for an ND image, and the green line is the value interpolated using the non-ND images. The profiles are similar, except that the ND filter value is lower by a couple of percent at the peak. The ND source is slightly wider too, by about 0.1 pixels.

The average fractional shortfall in Max da for the ND images is: 0.044 The average difference in the width of da for the ND images is: 0.110 pixels

Figure 3: The differential radial profile, 7-jan-1992, 20:30:16 UT.
See text


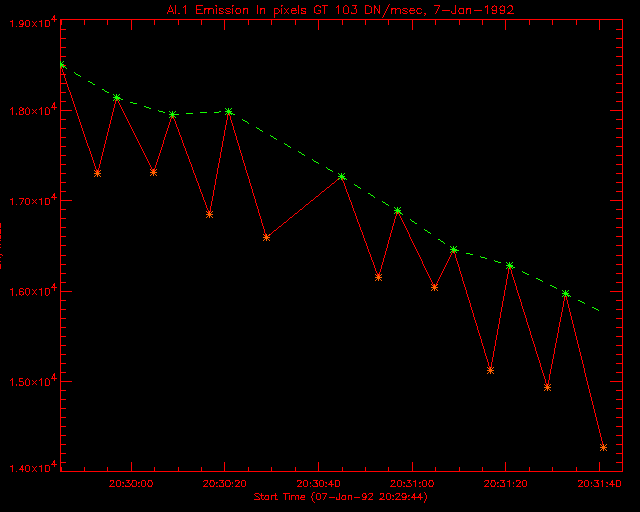
Here's another way to look at it. Figure 4 is a plot of the amount of brightness in each image that is concentrated in bright pixels; in this case in pixels with brightness greater than 103 DN/msec. Again, orange stars are the ND images, and green ones are the non-ND images, the green dashed line is interpolated using the non-ND images. The same thing happens; there is slightly less emission into the bright pixels for the ND images.

The average fractional shortfall for the ND images is: 0.061

Figure 4: Al.1 Emission for the brightest pixels versus time, 7-jan-1992.
See text


PART 2) EXPOSURE TIME EFFECTS:

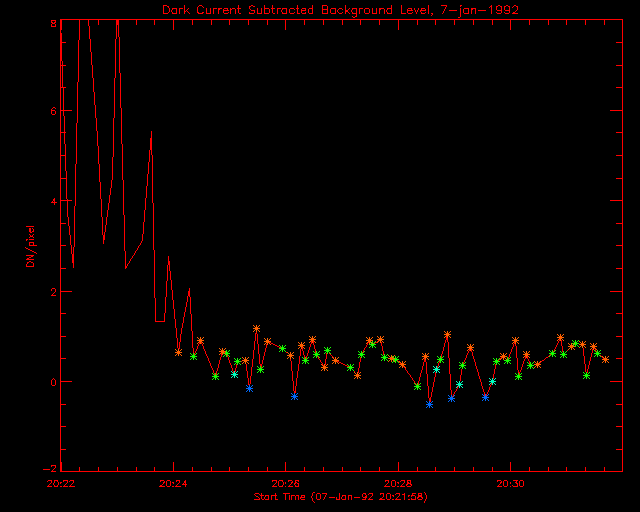
If you look back at the original plot (Fig. 1), you will note that the values of the total emission for the shortest exposures are less than the others. (These are the dark blue stars, with MBE=0, no ND filter, and an exposure time of 0.95 msec.). There are at least two effects that lead to this, and it's not clear which is dominant. The first is that for shorter exposures, there are more negative pixels included in the total emission. This next plot, Figure 5, is a time plot of the Background level: i.e., the average Dark Current Subtracted DN for the minimum 8x8 pixel region in each image. Note that we're making a distinction between 'Dark Current' and 'Background'. Dark Current is what's subtracted from the images by SXT_PREP. Background is what's left over, in the dimmest part of the image.

Figure 5: Background level, after dark current subtraction, 7-jan-1992.
See text

The different exposure levels are denoted by dark blue, light blue, green and orange stars as before. The shortest exposures have the lowest background level, and longer ones have higher levels. All of these images have had the same values of the dark current subtracted, a common happening before the entrance filter holes, so this is a reflection of the original data. This background is not due to scattered X-rays from the source, since it does not follow the flare time profile. (For large flares this 'background level' often does follow the flare profile for long exposures.)

The excess background could be X-rays from the active region behind the flare, or straylight. It is unlikely that this is an effect of time variation in the actual dark current; if dark current varied much with exposure time, we would expect it to vary with the exposure time before the correction for the ND filter. Instead this effect depends on the effective exposure time, after the ND correction. Thus the 1.4 msec, ND-filter images, which have non-corrected exposure times of 16 msec, (light blue stars), have smaller values then the 2.9 msec non-ND images (green stars).

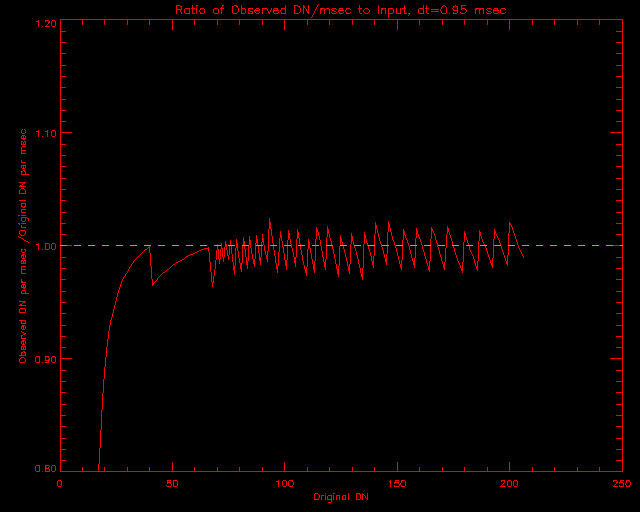
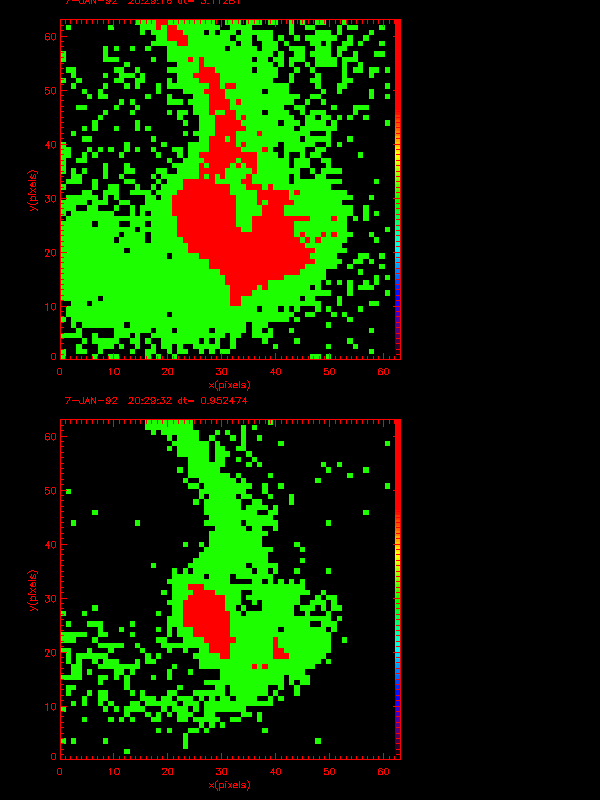
Table 1: Average Background Levels, 7-jan-1992.
Exp. time (msec) Background Level (DN) Uncertainty
0.964821 -0.339679 0.129140
1.39112 0.0851403 0.148828
2.87524 0.467829 0.229240
3.09598 0.691986 0.246239

Note that the shortest exposures have negative background levels; the values of the total emission are reduced by all of those negative pixels. Figure 6 is a plot of the fraction of the total emission that is in negative pixels for each image. The shortest exposures have the largest fractions, above 1%. But the emission in the shortest exposures is underestimated by more like 3%, so there must be some other effect.

Av. fraction of emission in Negative Pixels for shortest Exposures: 0.013

Av. shortfall of Total Emission for Shortest Exposures: 0.029

Figure 6: Fraction of the total AL.1 emission in negative pixels, 7-jan-1992.

See text


There is another effect of exposure time that may also show up. The amount of brightness which is emitted into pixels which have non-time-normalized Data Numbers of 64 or less is always underestimated . Here's how it happens (courtesy of L. Acton): The CCD collects some charge, the gain in the amplifier is set such that 100 electrons out of a CCD pixel causes the analog-to-digital-converter (ADC) to increment 1 unit. The ADC is a 12 bit device that converts an analog signal to a digital number. For those digital numbers less than or equal to 64 the telemetry sends down the actual number -- throwing away the 4 high-order bits. For those digital numbers > 64 Freeland's software compresses the number into an 8-bit number which is sent down.

DN's greater and less than 64 are treated differently, below 64, the compressed DN remains the same as the original DN, and the 'observed' uncompressed DN is the same as the original DN, which is less than the original value of the CCD current divided by the gain constant. Thus the observed value of the brightness in pixels with DN < 64 is always less than the original value.

For DN's greater than 64, this is not the case, because the decompression algorithm rounds numbers to the nearest integer. Here's an example, set the original current to 4000 CCD e's/msec or 40 DN/msec, the exposure time to 0.96 msec (the lowest exp. time for the 7-jan-1992 flare). the original source DN is (4000/100)*0.96 = 38.4. If the dark current is 13 DN, then the output compressed DN is 51. The observed DN/msec is (51-13)/0.96 = 39.58, which is less than the original value of 40. But if the orginal Dn is 195, the compressed-uncompressed DN is 198.96, due to the rounding in the decompression algorithm. The plot in Figure 7 shows an example. It is of the ratio of the observed to original Dn/msec as a function of the uncompressed DN. Numbers below 64 DN are always underestimated, often by a couple of percent.

Figure 7: Ratio of observed DN/msec with respect to input values for exp. time=0.96 msec.

See text


Lest you think that this is no big deal, the two images in Figure 8 show how many pixels can have DN < 64 for short exposures. The top image for the 7-jan-92 flare has an exposure time of 3.1 msec, the bottom image here has an exposure time of 0.95 msec. Red pixels have DN > 64, and green pixels have 20 < DN < 64. As you can see, substantial parts of the source have small DN's. This is always true for the shortest exposures of the set. For this case, the fraction of emission in pixels with DN < 64 is approximately 0.30 for the 3.1 msec exposure, but 0.50 for the 0.95 msec exposure.

Figure 8: Images of the 7-Jan-1992 flare for long (top) and short (bottom) exposure times.

See text


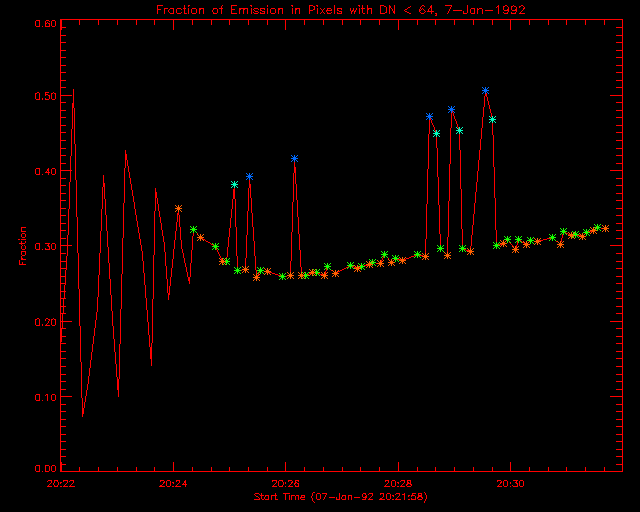
The next plot, Figure 9, is simply the fraction of the emission in pixels with original, compressed DN < 64 for each image, the colored stars represent the same exposure times as before (dark blue, dt=0.95 msec, light blue, dt=1.4 msec, green, dt=2.9 msec, orange, dt=3.1 msec). As you can see, the shortest exposures have much larger fractions of the emission in the pixels with DN < 64, for the shortest exposures, as much as 50% of the emission comes from the pixels with DN < 64. This causes at least some of the underestimation in the total brightness.

Figure 9: Fraction of the emission in pixels with DN < 64, 7-jan-1992.

See text


Conclusions

Based on the study of the Al.1 images of the flare of 7-jan-1992, at approximately 20:20 UT, here are some conclusions.

(1) The ND filter, on average, causes an increase in the width of the radial profile of flare sources of the order of 0.1 FR pixels.

(2) For equal corrected exposure times, The ND filter can also cause a reduction in the brightness in the brightest pixels by a few percent, with different values for different flares.

There are also two exposure time effects, which systematically reduce the brightnesses observed for short exposures (which include ND filter images).

(3) Background pixels are more likely to be negative for shorter exposures. Some of the difference between background levels for long and short exposures is due to scattered X-rays from the source (there are more of these for longer exposures) but the difference does not typically show the flare time profile; there seems to be non-flare X-ray emission present, which is not accounted for by dark current subtraction.

(4) The compression and decompression algorithms systematically underestimate the values of the brightness in dim pixels; those with original Data Numbers less than 64. This causes an underestimation of the total brightness by up to 5% for those images.

That's all for now, bye.

Back to jimm Home page?

Back to Top of ND_DEMO?

Comments to: jimm@ssl.berkeley.edu


Written, 28-Aug-1996, jmm