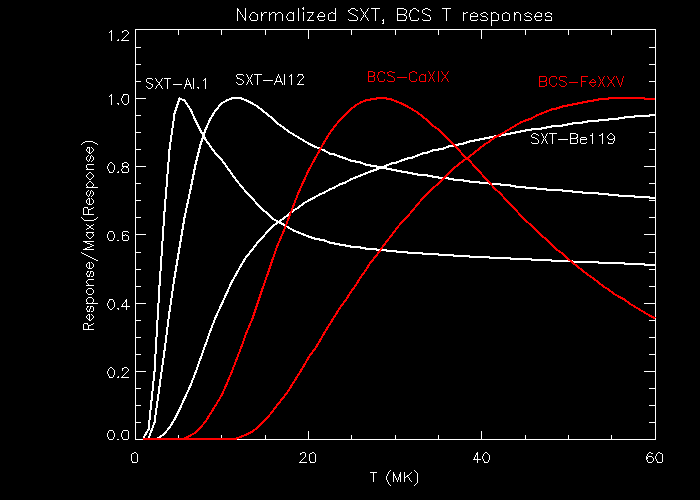
Figure 1.The normalized T response for the SXT filters and BCS channels used. The SXT response curves are white, the BCS responses are in red. Note that the SXT responses extend to high temperatures. Since the T responses are so broad, we do not expect to resolve features in the DEM smaller than a few MK. The BCS responses are obtained using the IDL program BCS_SPEC, which is distributed as part of the SolarSoft software package . The solar coronal abundances used in the SW are adapted from Meyer (1985).
The analysis was carried out for 92 flares which occurred between October, 1991 and November, 1992. These were chosen from an earlier sample of flares used to obtain the variation of Emission Measure versus Temperature for SXT and GOES, and were chosen so that the peak of emission in each channel/filter was available.
A number of different models for the DEM have been tried, with varying results. Two-temperature models work fairly well for many flares, particularly early in flares. During the flare decays, models for which the DEM is a monotonically decreasing function of temperature often work well. For a number of flares, no model fit the data particularly well; in many of these cases it is obvious that there is a source seen by the BCS, a full-sun instrument, that is not present in the SXT data; in other cases, there are different data gaps for the two different instruments, which are too large for interpolation; for large flares, there may have been saturation problems in the BCS channels. For a few flares, the flux in the FeXXV channel was always seriously underestimated by the model; for these cases, either there was a high temperature component that was missed or the FeXXV response is incorrect. This could be due to abundance variations or ionization non-equilibrium effects --- if the FeXXV ion is over abundant, there will be more counts in the channel. We will return to these events on an individual basis in the future.
Note that by ``a good fit'' we mean a reduced chi-squared value of approximately unity, after assuming a systematic error of 5% in the photon flux. So a ``good fit'' means that the photon fluxes in each channel/filter are within a few percent of the observed data, for the entire flare.
The final sample contains 80 flares; DEM distributions were derived with 9 second time resolution, for roughly 30 to 100 times for each flare.
Results
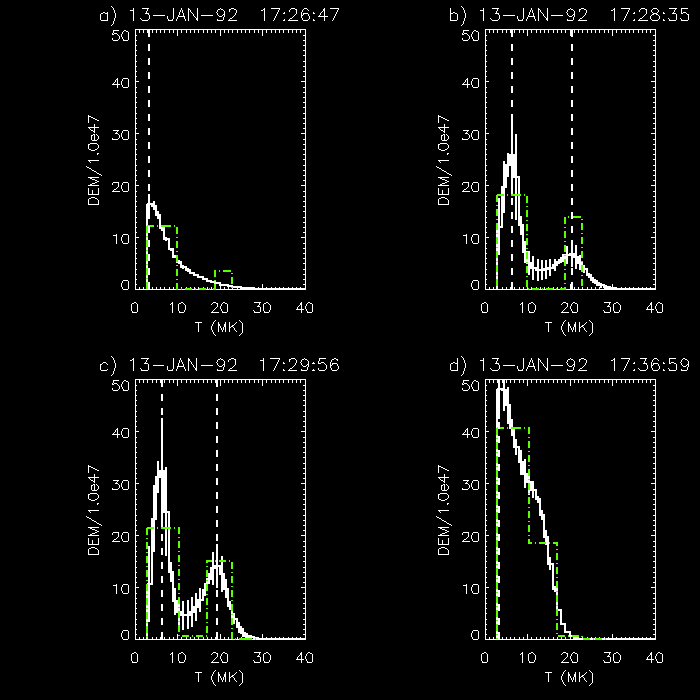
Since both two-component and monotonically decreasing functions seem to fit the data for different flares and time intervals, a model that can exhibit both kinds of behavior is useful. We divide the temperature range into 4 bins and assign an emission measure to each bin. The amount of EM in the bins is varied to minimize chi-squared. (We use four bins since we have five data points to work with.) This histogram-DEM usually fits the data fairly well, but we can improve the solution by using it as the starting point for a Maximum Entropy Method (MEM) calculation. (The MEM algorithm is the same as that used for HXT images, see Sakao, 1994.) A sample is shown in Figure 2, for the flare of 13-Jan-1992. Note that the units of all DEMs here will be EM/(1047 cm-3) per MK, so that the total emission measure is the integral of the DEM over T, not ln(T) as is often used.
Figure 2. The DEM for different times for the flare of
13-Jan-1992. The green dash-dot line is the histogram-DEM, and the
solid line is the MEM-DEM. The values of the temperature for the
different components are given by red dashed lines. The four plots
correspond to: a) the first SXT Al12 flare-mode image; b) the maximum
T for the high-T hump; c) the BCS-FeXXV channel maximum; d) the
SXT-Al.1 maximum. The high-T component is really prominent
here. Notice how the peak of the high-T component decreases with time
as the emission measure increases; the two components merge later in
the flare.
For this flare, there is a distinct high temperature hump in the
DEM. This happens for 12 of the 80 flares. When the hump is present,
the results look very much like some results obtained from SMM data
for a flare of 8-Apr-80 by Strong et al. 1986. The high-T component
pops up, then increases in emission measure, while decreasing in
temperature, until it merges with the low-T component.
More typically, the DEM has no discernable hump at high
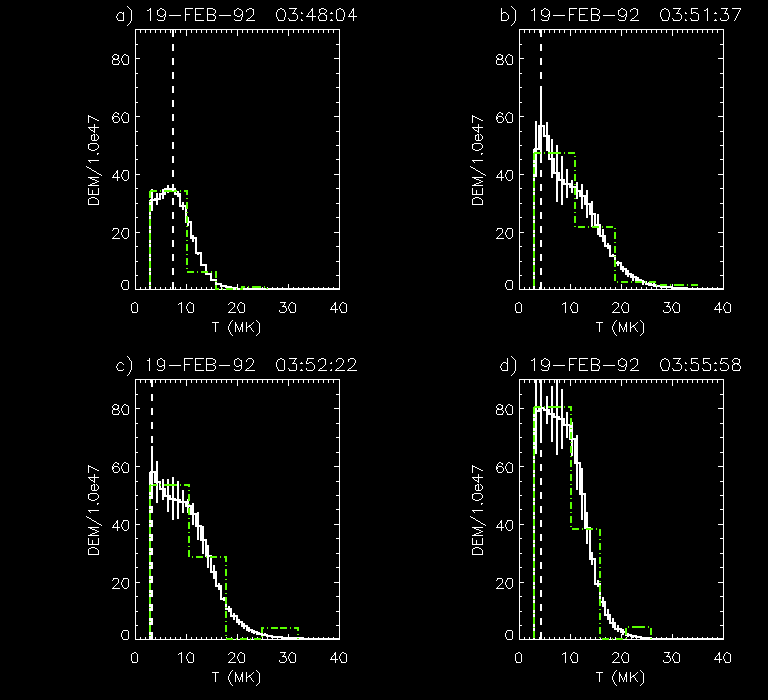
temperatures. An example is shown in Figure 3,
which is plot of the DEM at four different times for a flare that
occurred on 19-Feb-1992. The behavior is qualitatively similar to
the cases which show a distinct high-T hump. The high-T DEM looks like
an extended tail on the low-T DEM, and it eventually merges with the
low-T component.
Figure 3. The DEM for different times for the flare of
19-Feb-1992. The format is the same as in Figure
2. Here there is no high-T hump. Only 12 out of the 80 flares
analyzed showed distinct high-T humps, but all flares showed some
emission measure in the 20 MK range.
Given the Soft X-ray DEM, we would like to see how the solar flare
plasma relates to the hard X-ray burst at different temperatures. It
is well-known that soft X-ray time derivative is similar to the hard
X-ray (or microwave) light curve. This is thought of as evidence for
``chromosphseric evaporation''; i.e., the idea that the soft X-ray
emission comes from a plasma that is heated by the nonthermal
electrons which are responsible for the hard X-rays. The nonthermal
electrons lose most of their energy via Coulomb collisions in the
chromosphere. The temperature rises and a high pressure region forms
which drives material both upward and downward (``chromospheric
evaporation and condensation''). The coronal temperature and density
increase as the evaporated material rises, resulting in soft X-rays.
The hard X-ray light curves are proportional to the time profile of
the input electrons. The soft X-rays, which come from the plasma
heated by the nonthermal electrons, are proportional to the
accumulated energy of the electrons up to a given time. The soft
X-ray emission is thus proportional to the time integration of the
profile of the input electrons, and the time derivative of the soft
X-ray profile will look like the hard X-ray time profile. This is
known as ``derivativity'' or the ``Neupert Effect''.
In a study of large flares observed by HXRBS, Dennis & Zarro
(1993) found that 80% of the flares showed good correlations between
hard X-ray peaks and peaks in the time derivatives of the soft
X-rays. They noted that gradual hard X-ray flares were less likely to
show correlations.
The question here is: How does the Neupert effect manifest itself
at different temperatures?
The answer is: It's different for different flares; not really a
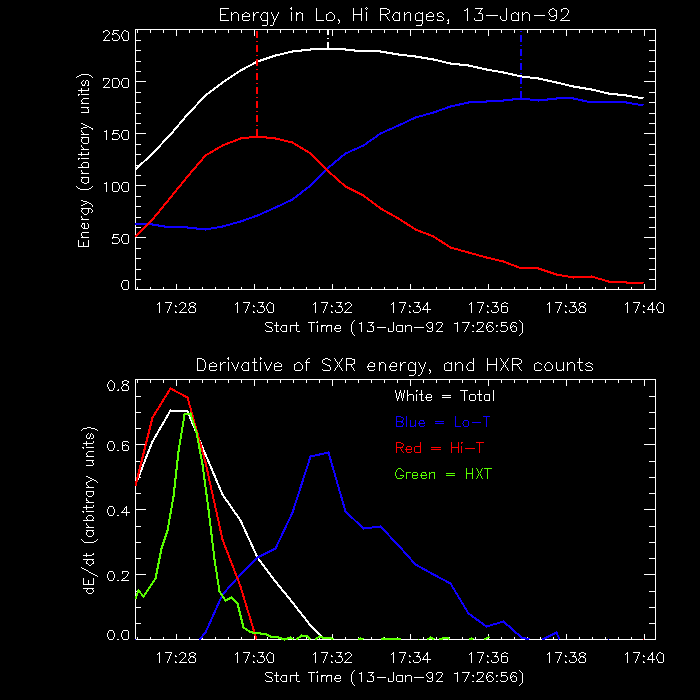
surprise. Figure 4 shows typical behavior for most flares. The top
plot is of the energy in the SXR plasma for the flare of
13-Jan-1992. The white line shows the total energy, the red line shows
the energy in high temperature plasma (T > 16.5 MK), the blue line
shows the energy in low temperature plasma (3 MK < T < 16.5
MK). The data is rebinned to 27 sec time resolution to smooth out
fluctuations. For this energy calculation, we've assumed that
the total flare volume does not change as a function of time, and that
the pressure is uniform throughout the flare loop, but variable with
time. The seemingly arbitrary value of 16.5 MK as the dividing line
between low and high-T plasma was chosen after an inspection of the
data showed that the time of the peak value of the high-T thermal
energy, and the times of peaks of the derivative of the high-T energy
are close to the same times for the counts in the FeXXV resonance
line. (This is true for all of the flares, not only the 13-Jan-1992
flare.) Thus when we refer to high-T plasma, we are referring to the
plasma that causes most of the response in the FeXXV line. All of the
rest is low-T plasma.
Figure 4. Top--The thermal energy as a function of time for the
13-Jan-1992 flare, total (white), high-T (red), low-T (Blue). Dash-dot
vertical lines indicate the peaks for the different
components. Bottom--The time derivatives of the energy for each
component (same colors), plotted along with the hard X-ray time
profile as seen in the HXT-M2 and HI channels (arbitrarily scaled,
green line), covering the energy range above 33 keV.
The bottom plot shows the time derivatives for each component,
compared with the hard X-ray time profile as seen by the HXT. The
color scheme is the same, and as you can see, the total energy and
high-T component look similar to the HXR burst. For the data to be
consistent with the Neupert effect for a given flare, we require that
the peak in the soft X-ray energy derivative be close to that for the
HXT data (within one time interval or 27 seconds) , and that the
derivative is positive only during the impulsive HXT burst. The high-T
derivative peaks before the HXR's and goes to zero at the end of the
HXR burst, consistent with the Neupert effect. The total energy
derivative is positive until 2 minutes after the HXR burst. This
implies that there is another heating source along with nonthermal
electrons. The low-T component behaves differently. Its derivative
peaks 4 minutes after the HXR peak, and remains positive for 8 minutes
after the HXR burst. This late increase in low-T plasma is at least
due to cooling of the high temperature plasma, not heating, since the
total energy is decreasing by this time.
How do we interpret this in terms of chromospheric evaporation?
Here's one possibility: The electrons pump up plasma to high
temperature. Some of the HXR electron energy may go into low-T plasma.
At the same time, there's a more gradual heating mechanism, unrelated
to the hard X-rays, that is slowly heating low-T plasma; this extra
heating lasts until 2 minutes after the HXR burst.
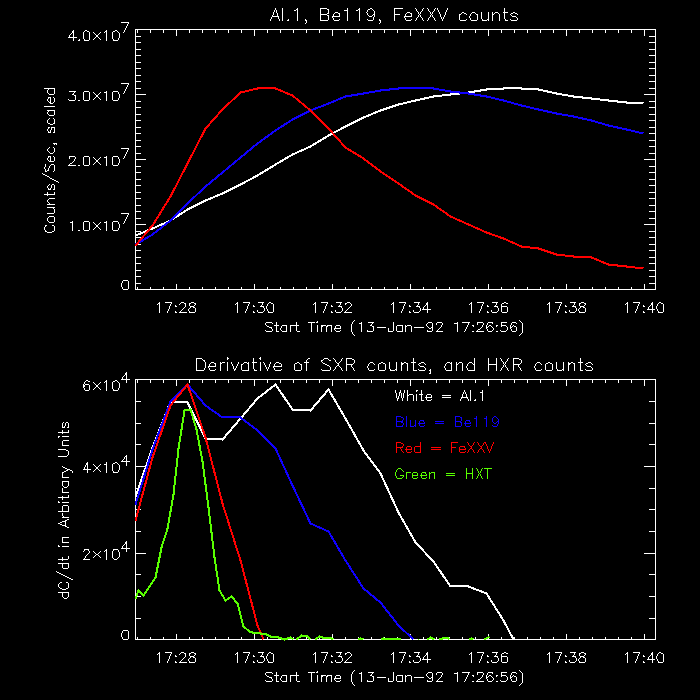
You can now clearly see the effect of how the DEM varies with time
in the SXT and BCS data. The top plot of Figure 5 shows the data from
the Al.1 (white) and Be119 (blue) filters of SXT, and the FeXXV
channel of BCS (red). The bottom plot shows the time derivatives of
the data, along with the HXT data. For this case, the curves have been
arbitrarily scaled. The FeXXV resonance line is only sensitive to
high-T plasma, and its derivative closely follows the hard X-ray time
profile. (The temperature responses are plotted in
Figure 1.) The Be119 filter is sensitive to low and high-T
plasma; its derivative has a peak with the HXR burst, and remains
positive long after the HXR burst. The Al.1 filter is sensitive to
high and low-T plasma, but is much more sensitive to low-T plasma than
the Be119 filter. Its derivative has a peak with the HXR burst, but
also has a peak long after the HXR burst. Al.1 brightness increases
(i.e., has a positive derivative) until 17:37 UT. The late increase in
Al.1 counts isn't due to extra heating, however; the total energy
decreases after 17:32 UT. Instead, it's due to cooling of the high-T
plasma, and the corresponding increase in low-T plasma. The plasma
moves into the temperature range where the Al.1 filter is more
sensitive, and the Al.1 brightness increases, even though the total
energy in the plasma is decreasing.
Figure 5. Top--SXT-Al.1 brightness (white), Be119
brightness (blue), and BCS-FeXXV brightness (red), for the
13-Jan-1992 flare, scaled arbitrarily. Dash-dot vertical lines
indicate the peaks for the different curves. Bottom--The time
derivatives for each curve, along with the HXT M2-HI data (green).
The lesson here is that you need to look at the DEM before you can
discuss whether there is extended heating. If, for example, you only
look at SXT Al.1 data, you may decide that heating lasts for a long
time after the HXR burst. If you only look at the BCS FeXXV data, you
decide that the heating ends with the HXR burst. In reality, the
answer is somewhere in between.
Now that we have a reasonably neat explanation for how the Neupert
effect works in most cases, let's look at a flare where it doesn't
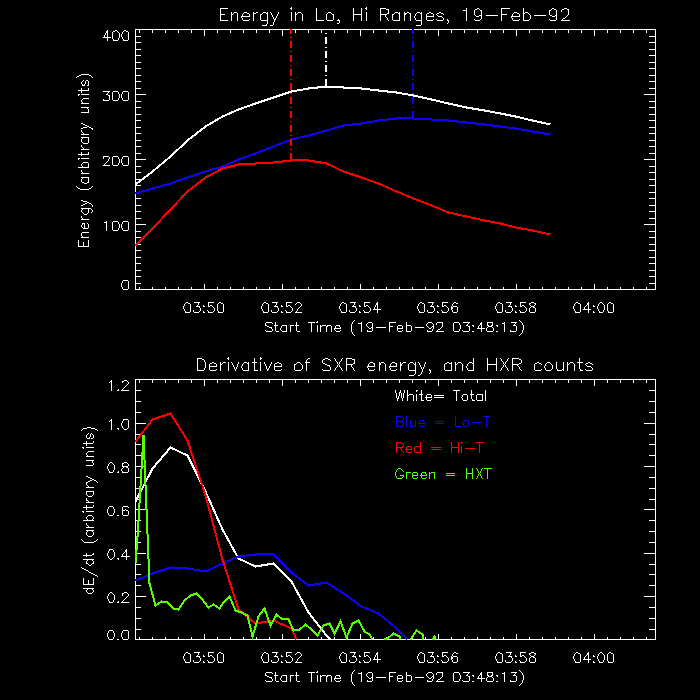
work so well at all. Figure 6 has the same format as Figure 4, for a flare that occurred on
19-Feb-1992. The top plot is of the energy in the SXR plasma. The
white line shows the total energy, the red line shows the energy in
high temperature plasma, the blue line shows the energy in low
temperature plasma. The bottom plot shows the time derivatives for
each component, compared with the hard X-ray time profile as seen by
the HXT.
Figure 6. Top--The thermal energy as a function of time for the
19-Feb-1992 flare, total (white), high-T (red), low-T (blue). Dash-dot
vertical lines indicate the peaks for the different
components. Bottom--The time derivatives of the energy for each
component (same colors), plotted along with the hard X-ray time
profile as seen in the HXT-M2 and HI channesl (arbitrarily scaled,
green line), covering the energy range above 33 keV.
Here, none of the derivatives look like the HXR time profile, and
they all remain positive after the HXR emission is gone. The
derivative of the high-T component and the total energy peak about 1
minute after the HXR peak, just after the end of the HXR burst. The
low-T component derivative has a smaller peak at this point, and a
higher peak later in the flare. The behavior of the low and high-T
components relative to each other is similar to the 13-Jan-1992 flare,
but their relation to the HXR time profile is different.
There were 29 flares in our sample with a peak HXT-M2
background-subtracted count rate of greater than 100 counts/sec. For
these flares we find that 23 are consistent with the Neupert effect
(as discussed in the previous section) at high temperature. Only 4 of
29 flares had low temperature emission consistent with the Neupert
effect. Fourteen of the flares had a total energy profile which was
consistent with the Neupert effect.
The Neupert effect is a high-T phenomenon. High temperature
plasma, such as that observed by the Yohkoh BCS FeXXV channel,
typically shows the Neupert effect (or derivativity). Low temperature
plasma, which dominates the radiation seen by the Yohkoh SXT, rarely
shows this property. One cannot use this last fact alone to argue that
the low-T soft X-ray emission is due to heating by a source unrelated
to the nonthermal electrons. The low temperature plasma energy may be
increasing later in the flare simply because high temperature plasma
is cooling and becoming low temperature plasma. When we look at the
total energy in the SXR plasma, we find that approximately one-half
(14 of 29) of the flares exhibit the Neupert effect. For the other 15
flares, an additional heating mechanism is indicated.
These results are similar to those found by Dennis & Zarro
(1993) who found that 80% of the flares in their sample showed the
Neupert effect. They used the GOES soft X-ray detector in their study;
the GOES detector is more sensitive to high-T plasma than the SXT, so
one would expect a good level of consistency with the Neupert effect.
It is important to note that the determination of the energy in
the different temperature ranges is the result of a rather simple
calculation. A more accurate calculation, involving the calculation of
the spatially resolved DEM, is clearly necessary. Some ideas of the
spatially resolved DEM can be gleaned from close examination of SXT
images, by comparison of different filter ratios, and this will be
done in future work. In the future, the HESSI mission will give
imaging and spectroscopic observations of flares for energies down to
3 keV. This will give us images of the high-T plasma continuum
emission and the Fe line complex, and can be used for DEM calculations
in conjunction with Yohkoh, SXI, or possibly Solar-B data.
Dennis, B. R. & Zarro, D. M., 1993 , Solar Physics, 146, 177.
Meyer, J.-P. 1985, Ap. J. Supp. 57, 173.
Sakao, T. 1994, Ph.d. Thesis, Univ. of Tokyo.
Strong, K.T., Bentley, R.D., Bornmann, P.L., Bruner, M.E.,
Cargill, P.J., Doyle, J.G., Lemen, J.R., Pallavicini, R., Peres, G.,
Serio, S., Simnett, G.M., Sylwester, J., Veck, N.J., 1986, in
Energetic Phenomena on the Sun, The Solar Maximum Mission Flare
Workshop Proceedings , NASA Conference Publication 2439, Section
5.3.
Preprints (postscript) can be obtained from
http://sprg.ssl.berkeley.edu/~fisher/mfl.ps.gz
Comments to:
jimm@ssl.berkeley.edu
21-May-1998, jmm
Yes
No
Conclusions
References