File:161fig2.png
From RHESSI Wiki
Size of this preview: 302 × 600 pixels
Full resolution (618 × 1,227 pixels, file size: 138 KB, MIME type: image/png)
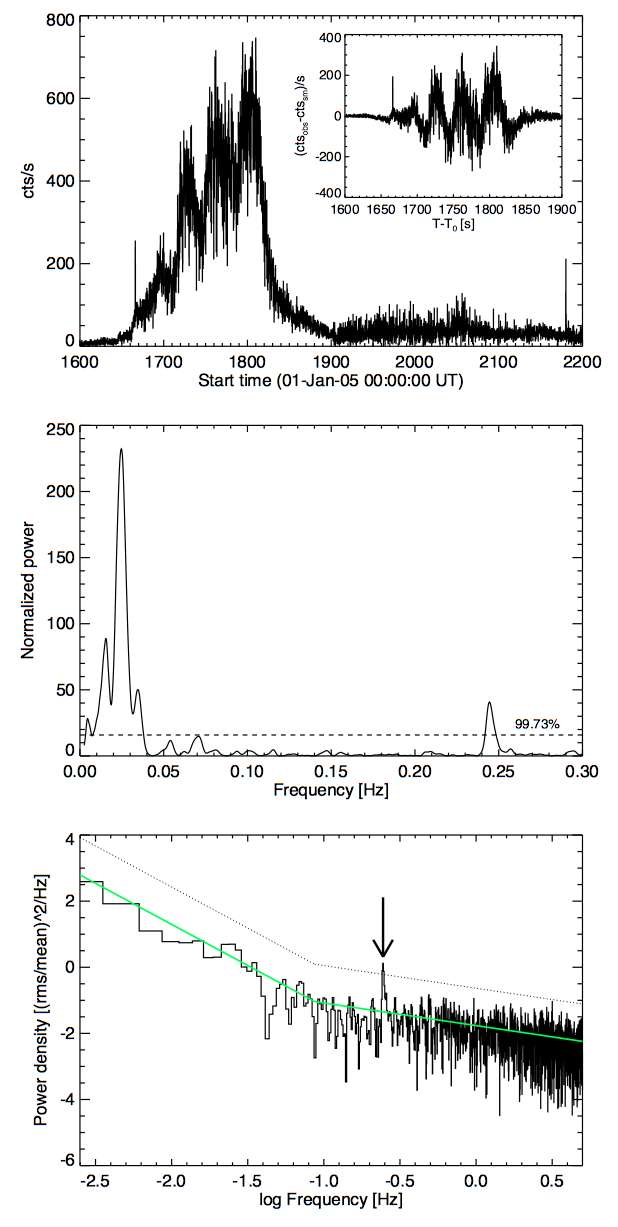
Upper panel: Summed and background subtracted light curve of the solar flare observed by RHESSI on January 1st, 2005. The inset shows the residual emission after subtracting a simple (boxcar) moving average. Middle panel: Periodogram analysis performed on the residual emission. Lower panel: PSD with best fit broken power-law (solid green line) and the Failed to parse (PNG conversion failed; check for correct installation of latex, dvips, gs, and convert): 3\sigma
significance level (dotted line) indicated. The arrow points to the significant frequency at Failed to parse (PNG conversion failed;
check for correct installation of latex, dvips, gs, and convert): f \approx 0.244
Hz.
File history
Click on a date/time to view the file as it appeared at that time.
| Date/Time | Thumbnail | Dimensions | User | Comment | |
|---|---|---|---|---|---|
| current | 07:46, 16 October 2011 | | 618×1,227 (138 KB) | Hhudson (Talk | contribs) | (''Upper panel:'' Summed and background subtracted light curve of the solar flare observed by RHESSI on January 1st, 2005. The inset shows the residual emission after subtracting a simple (boxcar) moving average. ''Middle panel:'' Periodogram analysis perf) |
- Edit this file using an external application (See the setup instructions for more information)
File links
The following page links to this file: