File:180f2.png
From RHESSI Wiki
No higher resolution available.
180f2.png (504 × 360 pixels, file size: 11 KB, MIME type: image/png)
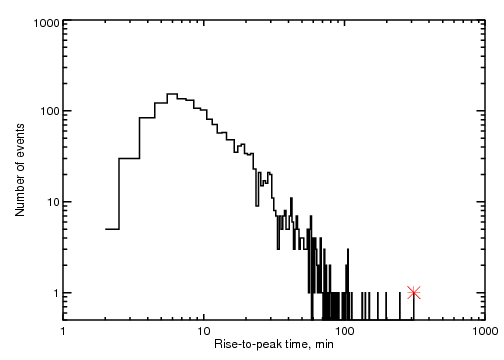
Histogram of the rise times (start to peak) of all of the tabulated GOES M-class and X-class flares since 1995. The red asterisk shows the location of our flare, somewhat above the general trend of the histogram.
File history
Click on a date/time to view the file as it appeared at that time.
| Date/Time | Thumbnail | Dimensions | User | Comment | |
|---|---|---|---|---|---|
| current | 20:09, 22 July 2012 | | 504×360 (11 KB) | Hhudson (Talk | contribs) | (Histogram of the rise times (start to peak) of all of the tabulated GOES M-class and X-class flares since 1995. The red asterisk shows the location of our flare, somewhat above the general trend of the histogram.) |
- Edit this file using an external application (See the setup instructions for more information)
File links
The following page links to this file: