File:190f1.png
From RHESSI Wiki
No higher resolution available.
190f1.png (542 × 346 pixels, file size: 46 KB, MIME type: image/png)
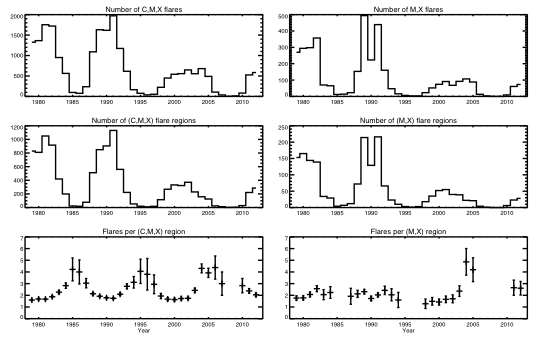
Records of flare productivity, per unique active region, from 1975 through 2012. The left panels include C-class events, and the right panels only the major M-and X-class events. The lower-right panel shows the interesting pattern of flare productivity that we discuss in the text.
File history
Click on a date/time to view the file as it appeared at that time.
| Date/Time | Thumbnail | Dimensions | User | Comment | |
|---|---|---|---|---|---|
| current | 16:54, 26 December 2012 | | 542×346 (46 KB) | Hhudson (Talk | contribs) | (Records of flare productivity, per unique active region, from 1975 through 2012. The left panels include C-class events, and the right panels only the major M-and X-class events. The lower-right panel shows the interesting pattern of flare productivity th) |
- Edit this file using an external application (See the setup instructions for more information)
File links
The following page links to this file: