File:99 TSI-SORCE-2008-now.jpg
From RHESSI Wiki

Size of this preview: 800 × 330 pixels
Full resolution (854 × 352 pixels, file size: 74 KB, MIME type: image/jpeg)
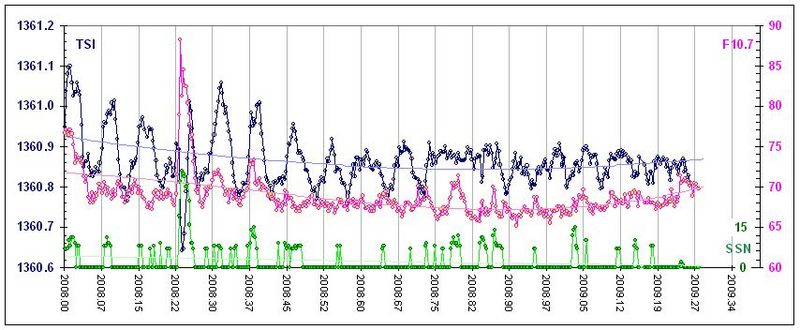
A plot, obtained from its daily update, showing three key indices of solar behavior from the beginning of 2008 to the present. The three indices are TSI (total solar irradiance, or "solar constant") in blue, F10.7 in red, and sunspot number in green. The long stretches of no sunspots at all mean that the Sun is in a state of low minimum activity, but the other indices are sensitive enough to see small variations - not necessarily understood yet!
File history
Click on a date/time to view the file as it appeared at that time.
| Date/Time | Thumbnail | Dimensions | User | Comment | |
|---|---|---|---|---|---|
| current | 18:49, 11 April 2009 | 854×352 (74 KB) | Hhudson (Talk | contribs) | (A plot, obtained from its [http://www.leif.org/research/TSI-SORCE-2008-now.png daily update], showing three key indices of solar behavior from the beginning of 2008 to the present. The three indices are TSI (total solar irradiance, or "solar constant") in) |
- Edit this file using an external application (See the setup instructions for more information)
File links
The following page links to this file: