File:Fig5.jpg
From RHESSI Wiki
Size of this preview: 799 × 600 pixels
Full resolution (2,618 × 1,965 pixels, file size: 304 KB, MIME type: image/jpeg)
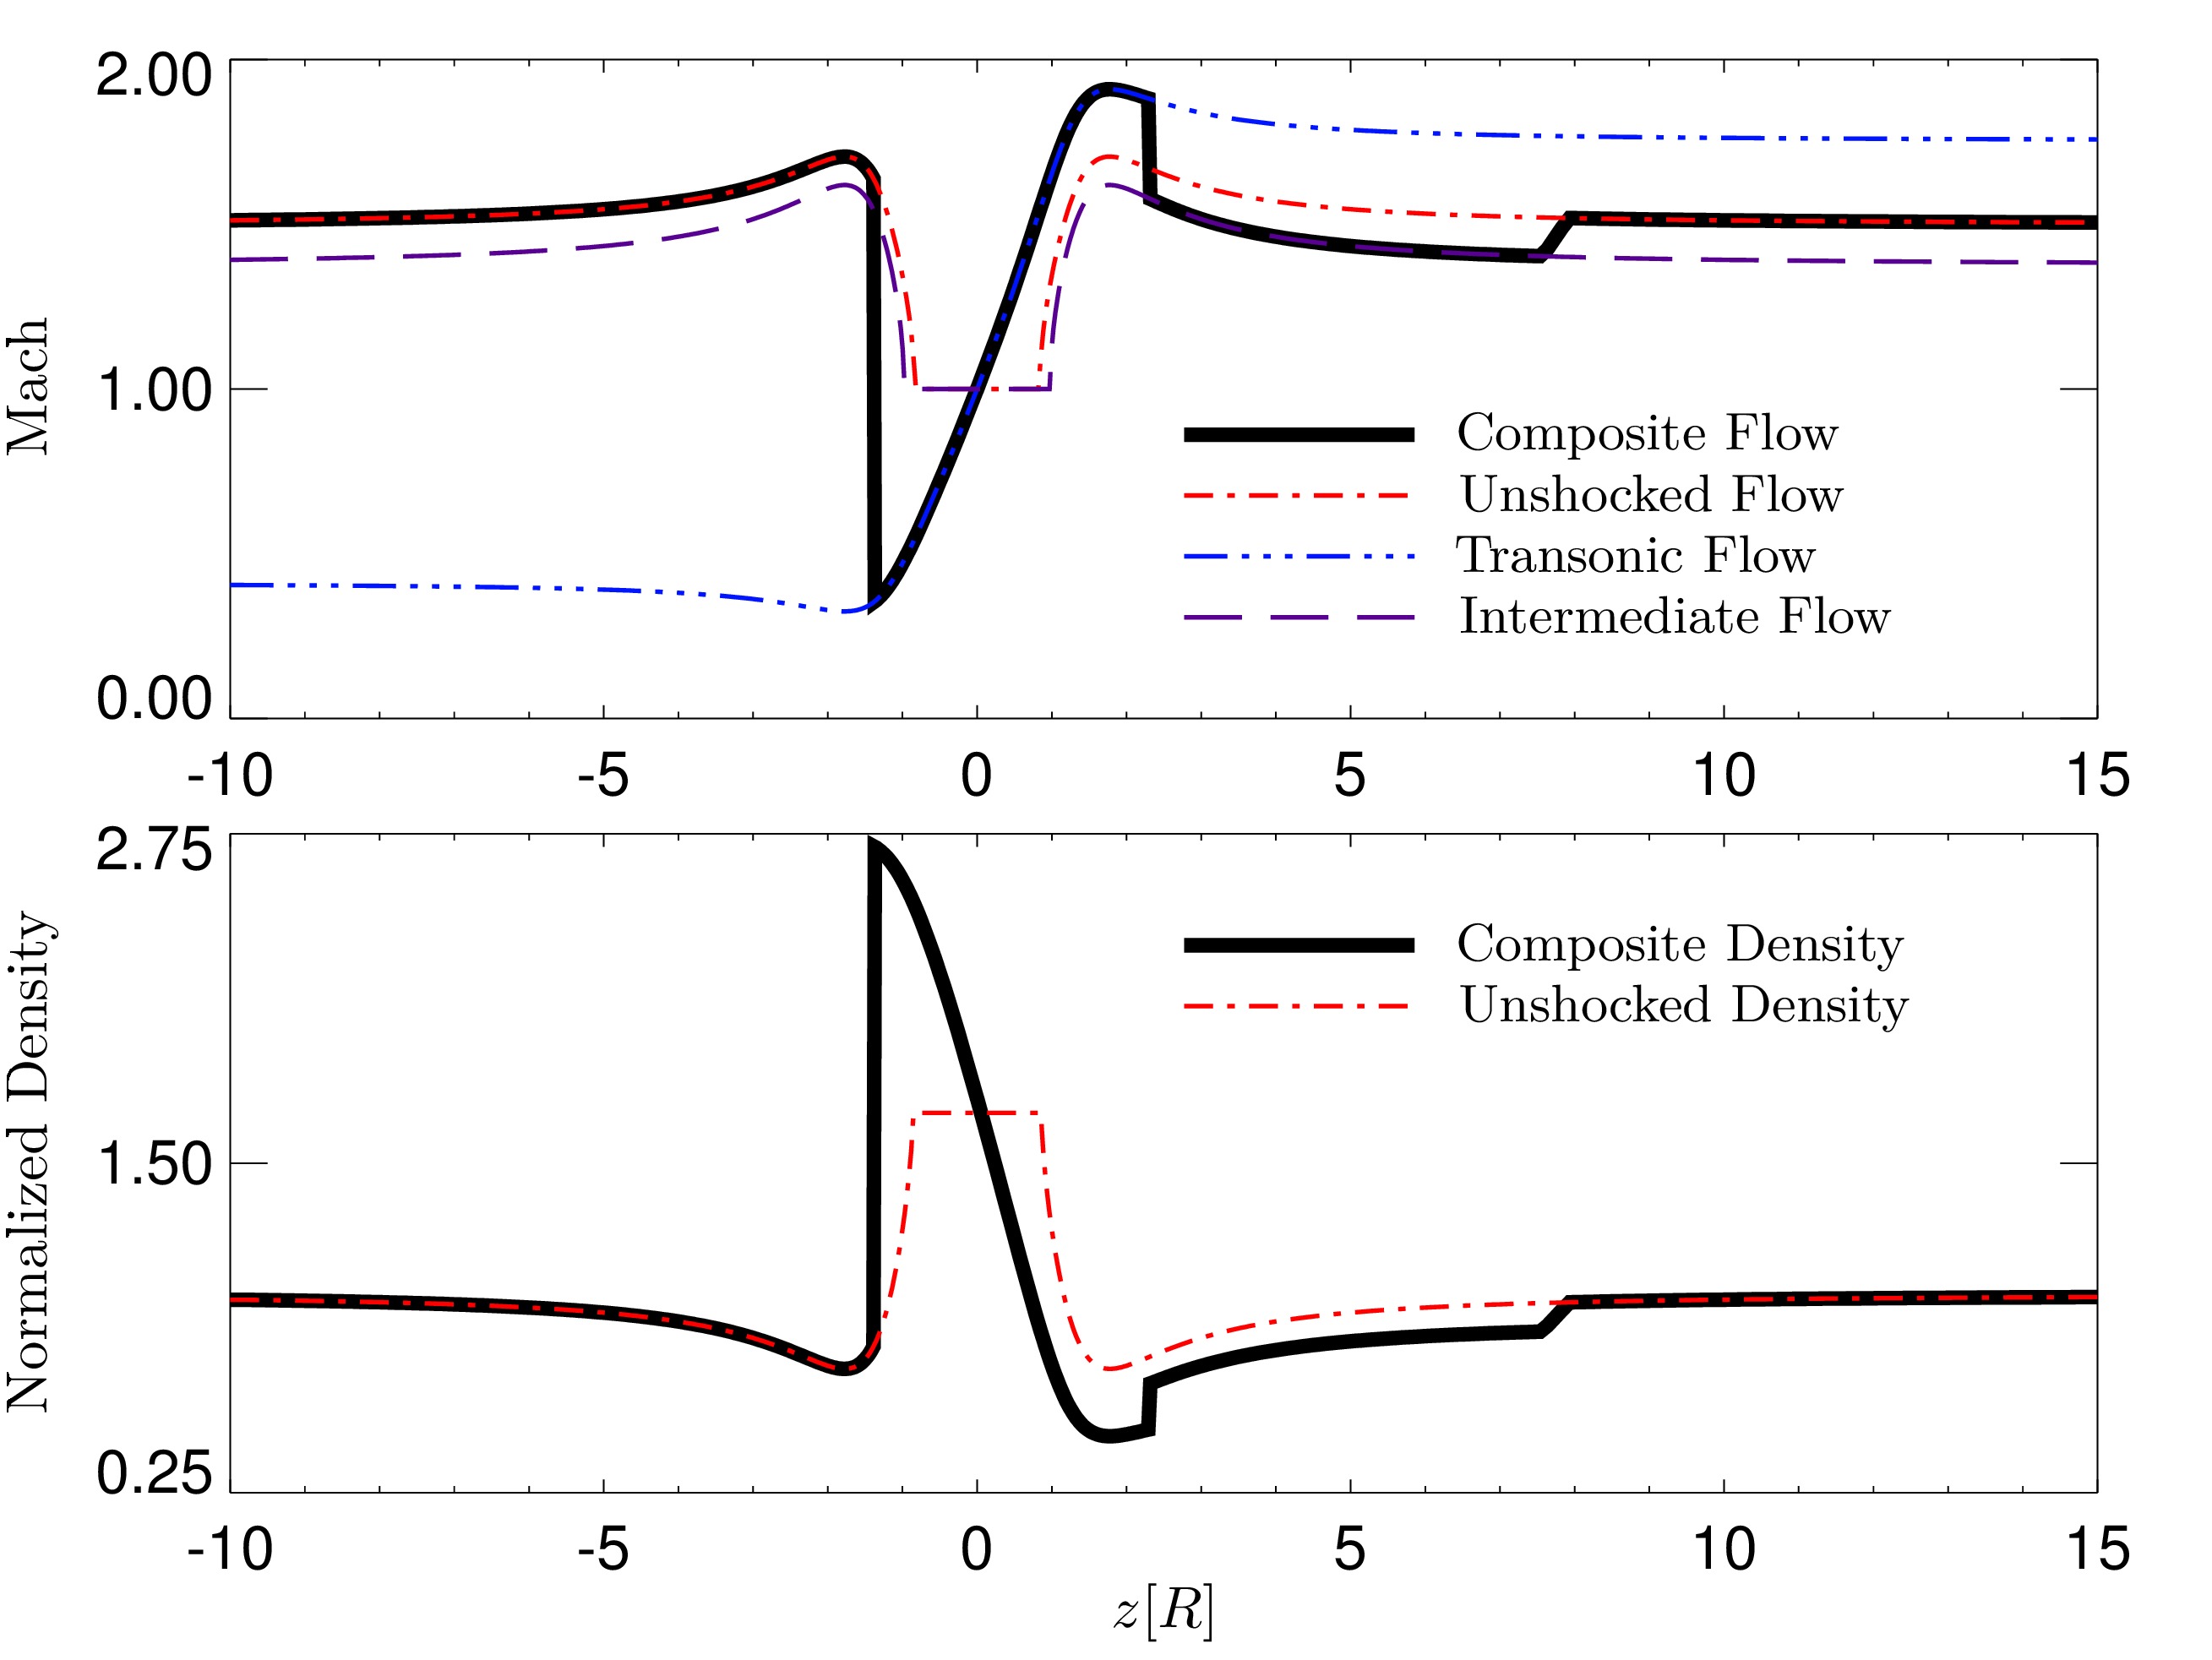
Flow Mach number (top) and density (bottom) along a flux tube plotted as a thick black curve. The flow enters with a specified speed (red). It shocks onto the transonic curve (blue) to pass the point of maximum constriction (z=0). It then shocks onto an intermediate flow line (violet) and retunrs to the original state (red) via a rarefaction wave.
File history
Click on a date/time to view the file as it appeared at that time.
| Date/Time | Thumbnail | Dimensions | User | Comment | |
|---|---|---|---|---|---|
| current | 22:57, 10 September 2013 | | 2,618×1,965 (304 KB) | DanaLongcope (Talk | contribs) | (Flow Mach number (top) and density (bottom) along a flux tube plotted as a thick black curve. The flow enters with a specified speed (red). It shocks onto the transonic curve (blue) to pass the point of maximum constriction (z=0). It then shocks onto ) |
- Edit this file using an external application (See the setup instructions for more information)
File links
The following page links to this file: