File:Hurfordetal2006.jpg
From RHESSI Wiki

Size of this preview: 646 × 599 pixels
Full resolution (665 × 617 pixels, file size: 206 KB, MIME type: image/jpeg)
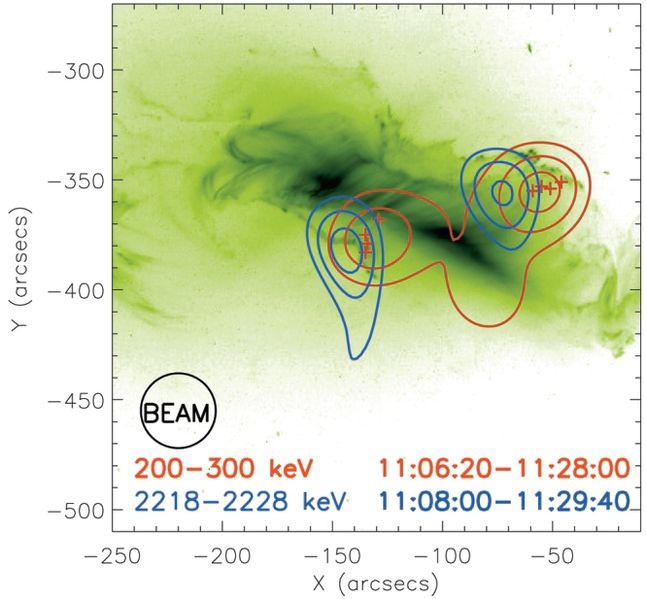
Fig. 2.—Overlay of the 50%, 70%, and 90% contours of 35� resolution gamma-ray images made with RMCs 6and 9 on a TRACE 195 Angstrom image of the 2003 October 28 flare. The red plus signs indicate 200–300 keV footpoint locations for successive adjacent intervals of 100, 120, 180, and 240 s beginning at 11:06:20 UT. The X and Y heliographic offsets are positive west and north of Sun center.
File history
Click on a date/time to view the file as it appeared at that time.
| Date/Time | Thumbnail | Dimensions | User | Comment | |
|---|---|---|---|---|---|
| current | 23:03, 23 January 2012 |  | 665×617 (206 KB) | Bdennis (Talk | contribs) | (Fig. 2.—Overlay of the 50%, 70%, and 90% contours of 35� resolution gamma-ray images made with RMCs 6and 9 on a TRACE 195 Angstrom image of the 2003 October 28 flare. The red plus signs indicate 200–300 keV footpoint locations for successive adjacen) |
- Edit this file using an external application (See the setup instructions for more information)
File links
The following page links to this file: