File:Kruckeretal2008.jpg
From RHESSI Wiki

Size of this preview: 800 × 424 pixels
Full resolution (1,027 × 544 pixels, file size: 203 KB, MIME type: image/jpeg)
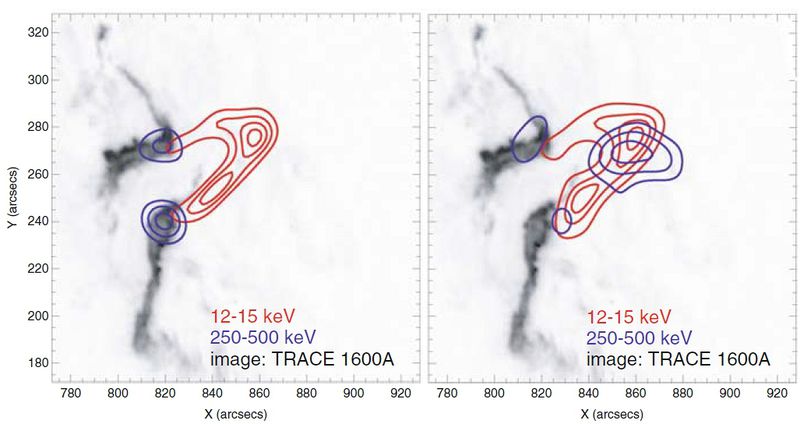
Images taken during the flare on January 20, 2005 at the peak time at 06:43:32 to 06:46:40 UTC (left), and during the decay phase at 06:50:00 to 06:55:01 UTC (right). Both figures show a TRACE 1,600Å image taken at 06:45:11 UTC overplotted with 12–15 keV (red) and 250–500 keV (blue) contours. The 12–15 keV image is reconstructed using a MEM algorithm and the contour levels shown are at 30, 50, 70, 90% of the maximum, while the Clean algorithm is used for the reconstruction of 250–500 keV images and 50, 70, 90% contours are displayed. During the peak the gamma-ray emission comes from footpoints, while later an additional coronal source becomes visible (from Krucker et al. 2008)
Krucker S, Hurford GJ,MacKinnon AL, Shih AY, Lin RP (2008) Coronal γ -ray Bremsstrahlung from solar flare-accelerated electrons. ApJL 678:L63–L66, doi:10.1086/588381
File history
Click on a date/time to view the file as it appeared at that time.
| Date/Time | Thumbnail | Dimensions | User | Comment | |
|---|---|---|---|---|---|
| current | 18:51, 24 January 2012 |  | 1,027×544 (203 KB) | Bdennis (Talk | contribs) | (Images taken during the flare on January 20, 2005 at the peak time at 06:43:32 to 06:46:40 UTC (left), and during the decay phase at 06:50:00 to 06:55:01 UTC (right). Both figures show a TRACE 1,600Å image taken at 06:45:11 UTC overplotted with 12–15 k) |
- Edit this file using an external application (See the setup instructions for more information)
File links
The following page links to this file: