File:Nugget f1.png
From RHESSI Wiki
No higher resolution available.
Nugget_f1.png (635 × 570 pixels, file size: 15 KB, MIME type: image/png)
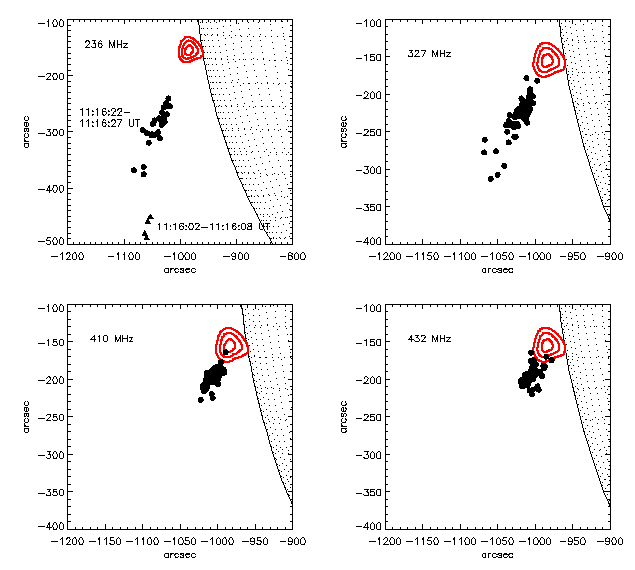
Figure 1: Centroid positions of the radio pulsations measured at several frequencies by the Nançay Radioheliograph and the simultaneous RHESSI Clean images in the 18-25 keV band (50%, 70%, and 90% contours) in the 5 December 2006 flare 11:16 UT. Time bins of 0.15 seconds having a radio flux above the average are shown as black dots for the four frequencies in which pulsations were present. Note the different size of the 236 MHz picture. An X-ray footpoint was observed at higher energies (see Fig. 2).
File history
Click on a date/time to view the file as it appeared at that time.
| Date/Time | Thumbnail | Dimensions | User | Comment | |
|---|---|---|---|---|---|
| current | 13:39, 13 April 2011 | | 635×570 (15 KB) | Mbattaglia (Talk | contribs) | (Figure 1: Centroid positions of the radio pulsations measured at several frequencies by the Nançay Radioheliograph and the simultaneous RHESSI Clean images in the 18-25 keV band (50%, 70%, and 90% contours) in the 5 December 2006 flare 11:16 UT. Time bin) |
| 13:33, 13 April 2011 |  | 1,097×914 (26 KB) | Mbattaglia (Talk | contribs) | (Figure 1: Centroid positions of the radio pulsations measured at several frequencies by the Nançay Radioheliograph and the simultaneous RHESSI Clean images in the 18-25 keV band (50%, 70%, and 90% contours) in the 5 December 2006 flare 11:16 UT. Time bin) |
- Edit this file using an external application (See the setup instructions for more information)
File links
The following page links to this file: