File:Spectra.gif
From RHESSI Wiki
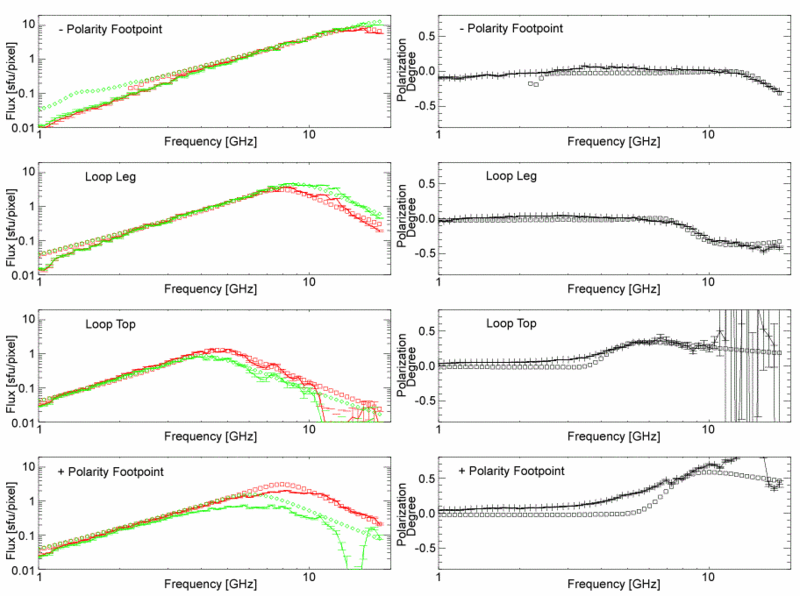
Spatially resolved flux (sfu/pixerl) and polarization spectra along the four lines of sight marked in the upper panels of the simulated flaring loop in Figure 2. The flux spectra in the left-hand panels show both RCP (red) and LCP (green), with open symbols from the model, and points with error bars from the corresponding simulated EOVSA images. Note the shift in peak frequency in different parts of the loop, due to the varying magnetic field strength. The polarization spectra show the degree of polarization changes from negative (LCP) at the footpoint with negative magnetic polarity to positive (RCP) at the looptop and positive polarity footpoint.
File history
Click on a date/time to view the file as it appeared at that time.
| Date/Time | Thumbnail | Dimensions | User | Comment | |
|---|---|---|---|---|---|
| current | 06:57, 25 March 2012 |  | 912×680 (49 KB) | Hhudson (Talk | contribs) | (Spatially resolved flux (sfu/pixerl) and polarization spectra along the four lines of sight marked in the upper panels of the simulated flaring loop in Figure 2. The flux spectra in the left-hand panels show both RCP (red) and LCP (green), with open symbo) |
- Edit this file using an external application (See the setup instructions for more information)
File links
The following page links to this file:
