From RHESSI Wiki
Pixon Results Summary=
- Time: 2-September-2002 00:07:36 - 00:08:20
- Energy Interval: 24.0 keV - 51.0 keV
- Detectors: All Detectors
- Image Size: 64 X 64
- Pixel Size: .5 X .5

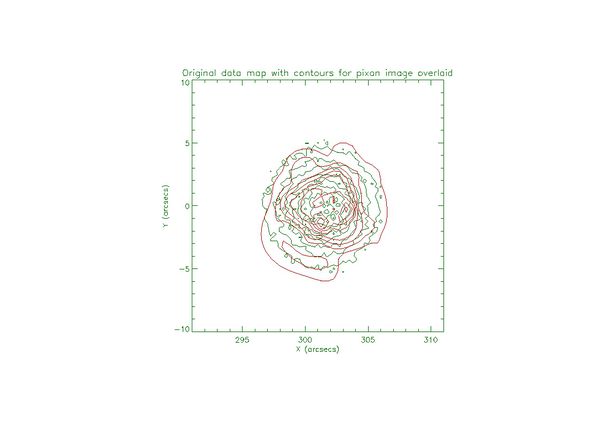
The original data map in green contours with the contours of the Pixon Image overlaid in red for an eventlist with total counts ~10e4
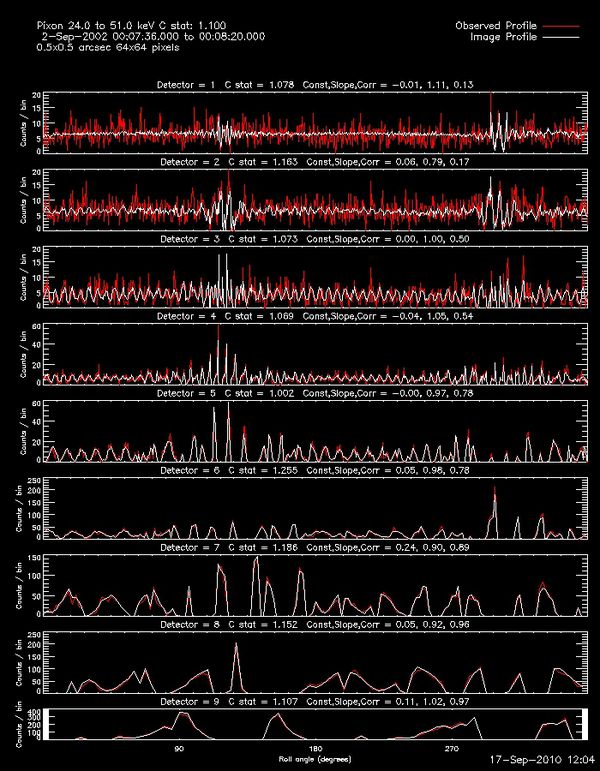
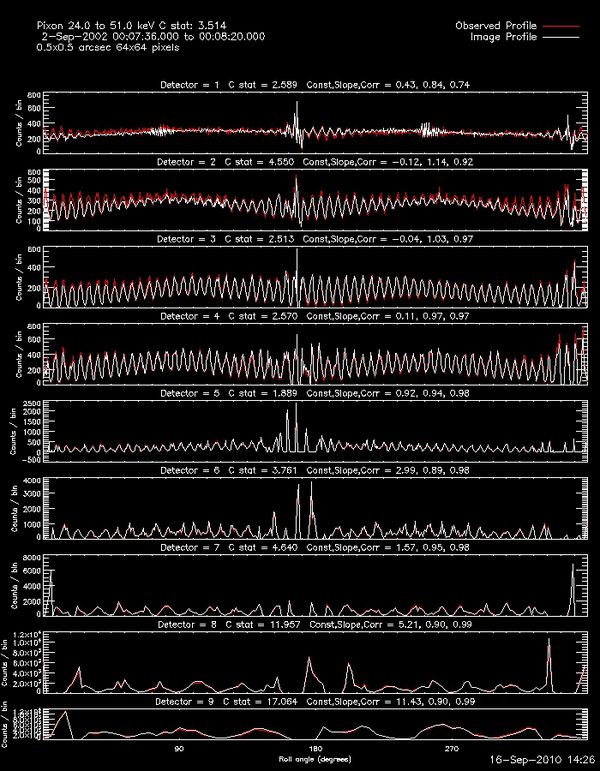
The profile for each detector along with the fitted profile from Pixon. The C statistic for each detector is also shown.

The original data map in green contours with the contours of the Pixon Image overlaid in red for an eventlist with total counts ~10e5
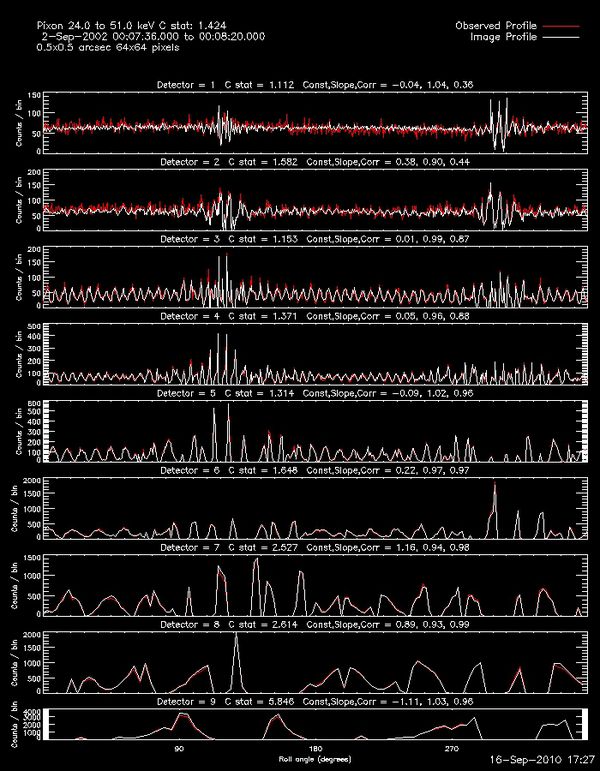
The profile for each detector along with the fitted profile from Pixon. The C statistic for each detector is also shown.
The original data map in green contours with the contours of the Pixon Image overlaid in red for an eventlist with total counts ~10e6
[Image:Pixon cstat profile sim 301 10e5.jpg|center|thumb|600px|The profile for each detector along with the fitted profile from Pixon. The C statistic for each detector is also shown.]]
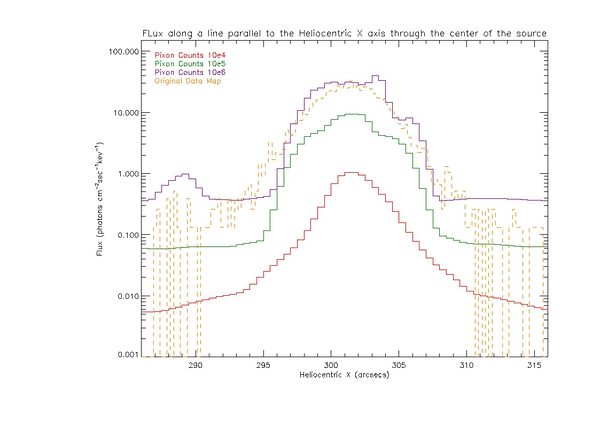
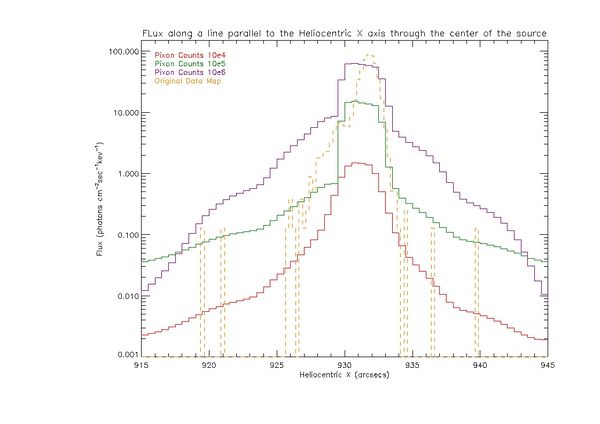
The flux profile along a line parallel to the Heliocentric X axis through the source center for reconstructed Pixon images with different total counts. The dashed line is the profile of the original data map.
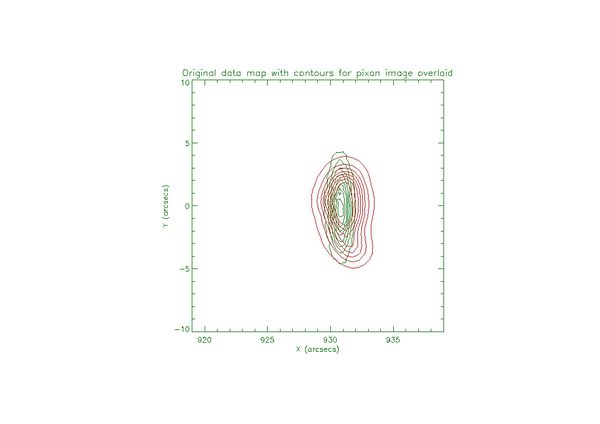
The original data map in green contours with the contours of the Pixon Image overlaid in red for an eventlist with total counts ~10e4.
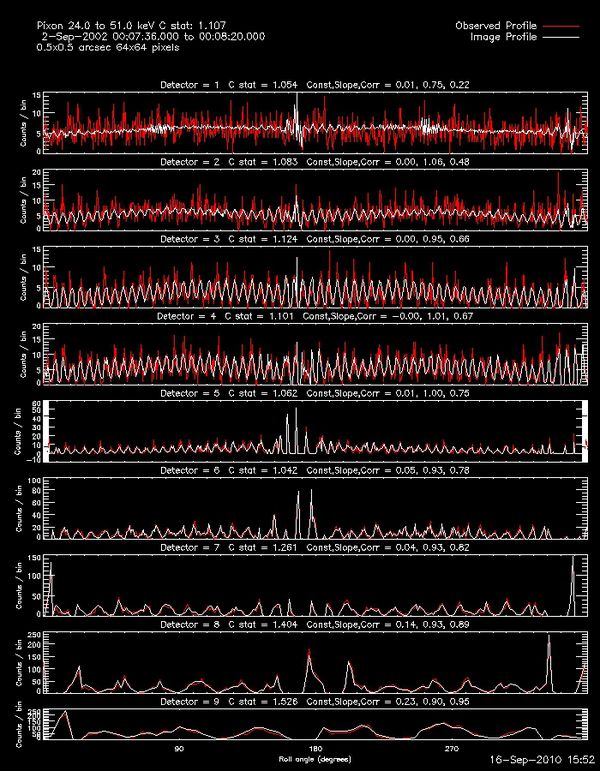
The profile for each detector along with the fitted profile from Pixon. The C statistic for each detector is also shown.

The original data map in green contours with the contours of the Pixon Image overlaid in red for an eventlist with total counts ~10e5.
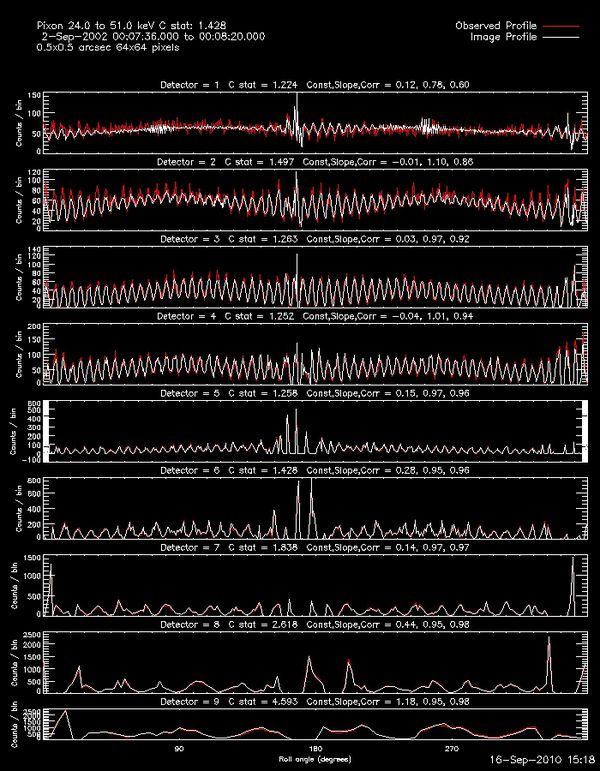
The profile for each detector along with the fitted profile from Pixon. The C statistic for each detector is also shown.
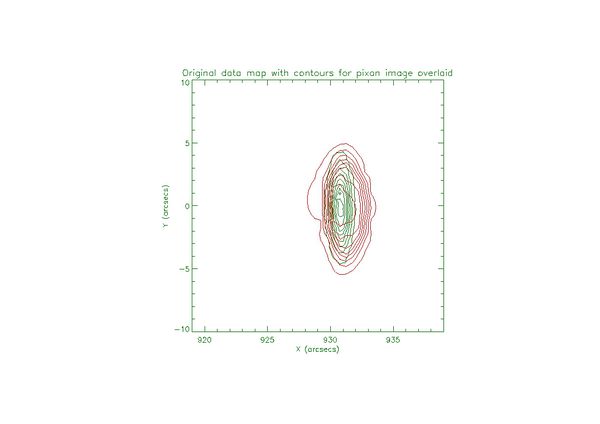
The original data map in green contours with the contours of the Pixon Image overlaid in red for an eventlist with total counts ~10e6.
The original data map with the contours of the Pixon Image overlaid for an eventlist with total counts ~10e6 near the limb.
The flux profile along a line parallel to the Heliocentric X axis through the source center for reconstructed Pixon images with different total counts. The dashed line is the profile of the original data map.
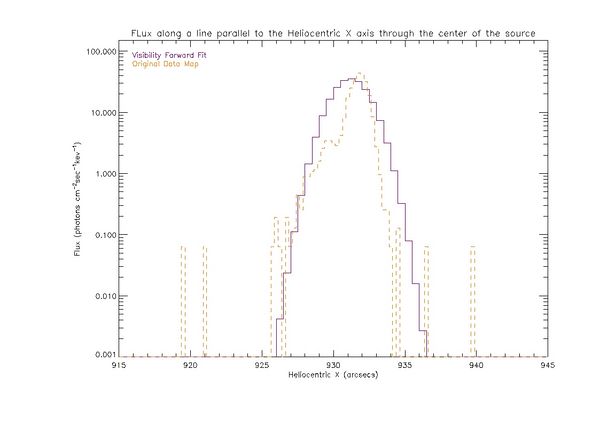
The visibility forward fit profile along the Heliocentric X direction along with the profile for the original data map.
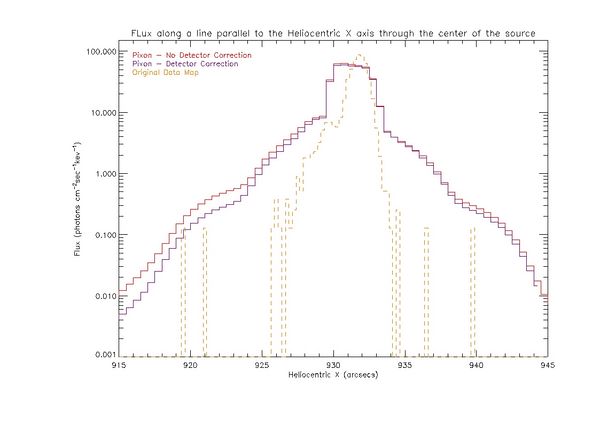
The profile along the Heliocentric X direction of the image profiles for a Pixon image with detector sensitivity corrections, with no corrections, and the original data map.


