Weekly Report 18Mar2011
From RHESSI Wiki
RHESSI Albedo Imaging Test
For the following test a circular Gaussian map was created with increasing standard deviations. From each of these maps a calibrated eventlist file was created. From these eventlist files Clean images were created. The Clean images were created with the following parameters:
- Detectors: 1 to 9
- Energy: 15 keV to 25 keV
- Time: 20-Feb-2002 11:09:10 - 11:09:40
- Clean Beam Width: Varied from 1, 1.5, 2
For the original set of runs the 50% contour of the image was calculated and the standard deviation in the X and Y direction was calculated. This was then plotted as a function of the standard deviation of the original map. There were problems with this approach, as the standard deviation of the map increased the Clean image broke up. This broke up the 50% contour so the standard deviation of the contour including the pixel with the maximum value of the flux were smaller than would be expected.
Due to this a new method was tried, with the standard deviation of the Clean image taken for the entire image instead of the 50% contour. The plot below shows the standard deviation in the X(Green) and Y(Red) direction as a function of the standard deviation of the original circular Gaussian Map. The images were made with a clean beam width factor of 1.
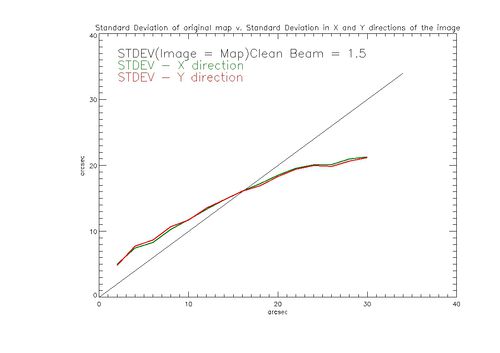
The plot below shows the standard deviation in the X(Green) and Y(Red) direction as a function of the standard deviation of the original circular Gaussian Map. The images were made with a clean beam width factor of 1.5 .
The plot below shows the standard deviation in the X(Green) and Y(Red) direction as a function of the standard deviation of the original circular Gaussian Map. The images were made with a clean beam width factor of 2.
The plots are discussed below:
The standard deviation of the entire image in the X and Y direction is plotted above versus the standard deviation of the original map. At lower standard deviations of the map the Clean image shows larger standard deviations in the X and Y directions. As the clean beam width of the images increases the standard deviation of the images in the X and Y direction get larger for the smaller standard deviations of the map. At a standard deviation of approximately 16 arcsec for the original map the standard deviation in X and Y of the image crosses over and becomes smaller than that of the original map. This occurs because at this point the image starts to fragment regardless of the clean beam width factor used.
The image created for a map with a standard deviation of 20 arcsec is below:
The maps above 16 arcsec may need a bigger field of view for the image or they break apart. This looks like it still causes an inaccurate measurement of the Standard Deviation. Using the whole map doesn't seem to alleviate problems caused when using just the 50% contour.
The Standard Deviations below 16 arcsec may be too large because of the noise introduced by using all detectors. I'm testing this by using different detector combination's.
Goals
- Create images for maps with two normalized circular Gaussians. One Gaussian will be smaller with ( a Standard Deviation of 6 arcsec) and the other larger (varying from a Standard Deviation of 6 arcsec to 20 arcsec). The images will be made using detectors 1 to 4 for one, and detectors 4 to 9 for the other. The centroids of the two images will be compared and the Standard Deviations. The reasoning is to check if Clean can differentiate the compact source from the extended source and the location of their centroids. This will be useful in dtermining if we can measure the centroids of a compact source with albedo.


