Weekly Report 8Apr2011
From RHESSI Wiki
RHESSI Albedo Imaging Test
RHESSI Clean Imaging techniques were used to image large groups of flares using different detector combinations and energy ranges. The following were used to create the Clean images:
- Time: Decided by the peak of a flare in the 25keV - 50keV range
- Energy: 12kev - 25keV, or 25keV - 50KeV
- Detectors: 3 to 9, or 3 to 6, or 7 to 9
- Clean Beam Width Factor = 2
For each energy range (12keV-25keV and 25keV-50keV) an image was made for each detector combination. Using the images the flux was measured for each detector combination. The centroids of each source was also measured. The differences in the centroid location were recorded to give the displacement of a compact or extended source from the complete source. In the final case the ratio of the flux in the extended sources in the 25keV-50keV band was taken with that of the compact source for the same flare in the 12keV-25keV band.
A discussion of all plots as a group follows below the final plot.
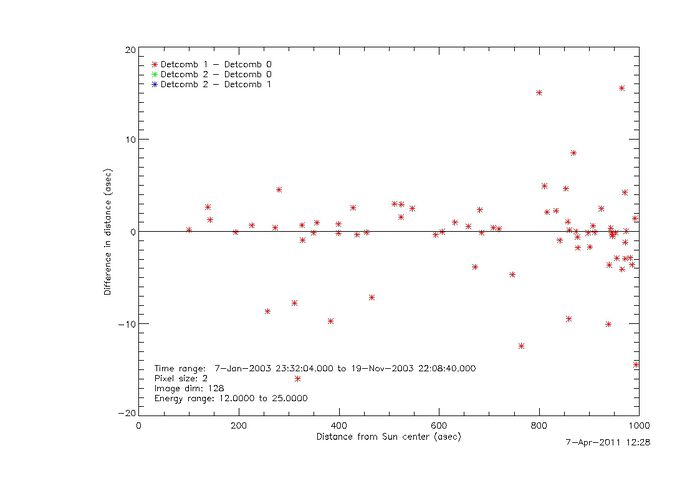
The plot below shows the difference in distance of the centroids using detectors 3-9 versus detectors 2-6 in the 12keV-25keV energy band.
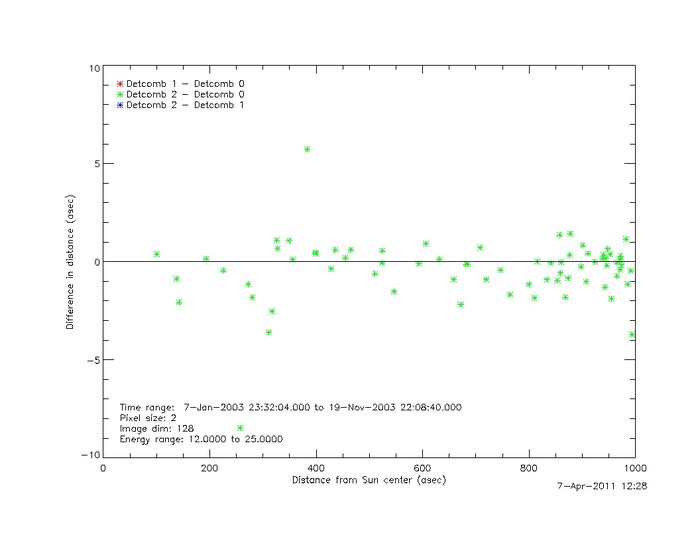
The plot below shows the difference in distance of the centroids using detectors 3-9 versus detectors 6-9 in the 12keV-25keV energy band.
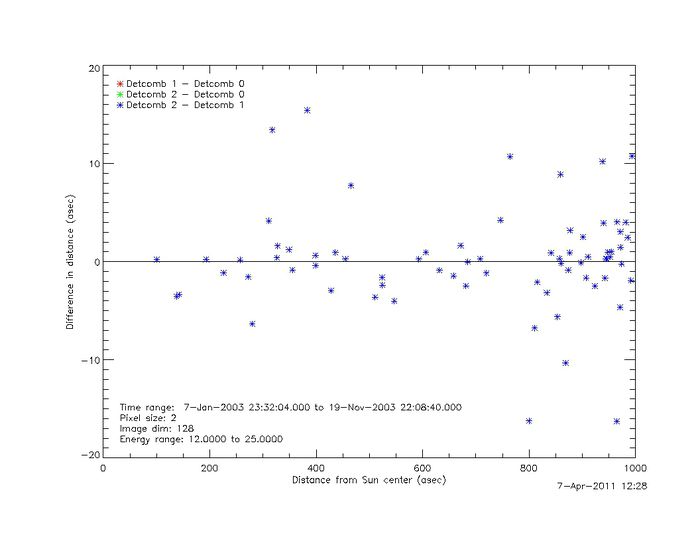
The plot below shows the difference in distance of the centroids using detectors 3-6 versus detectors 6-9 in the 12keV-25keV energy band.
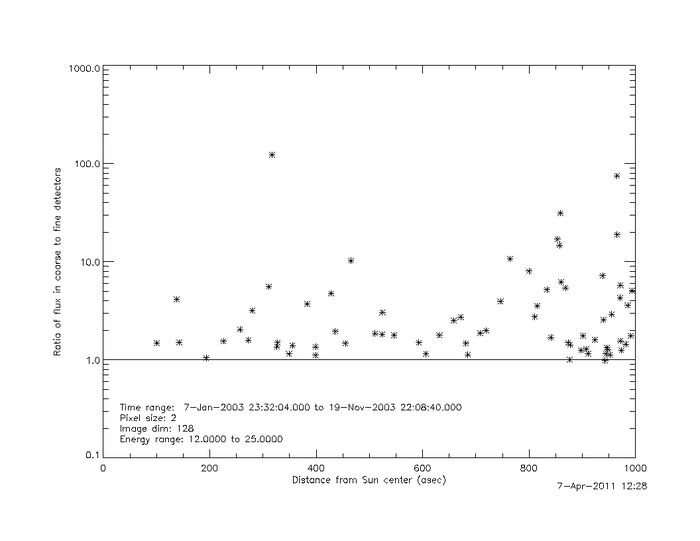
The ratio of the extended source to the compact source is shown below.
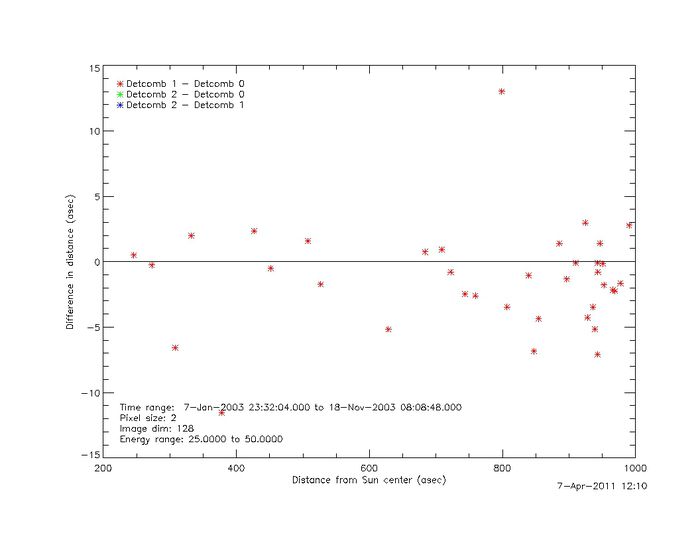
The plot below shows the difference in distance of the centroids using detectors 3-9 versus detectors 2-6 in the 25keV-50keV energy band.
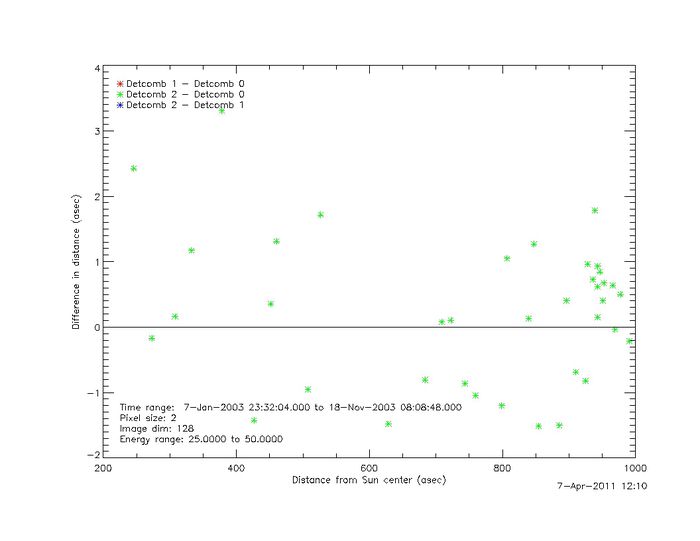
The plot below shows the difference in distance of the centroids using detectors 3-9 versus detectors 6-9 in the 25keV-50keV energy band.
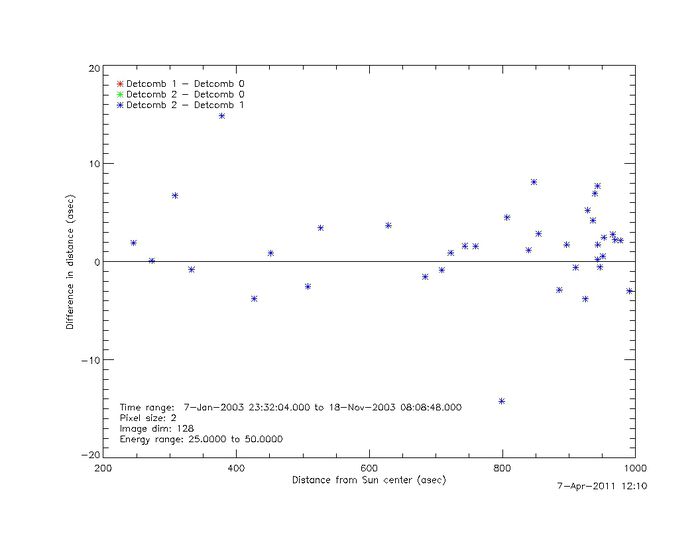
The plot below shows the difference in distance of the centroids using detectors 3-6 versus detectors 6-9 in the 25keV-50keV energy band.
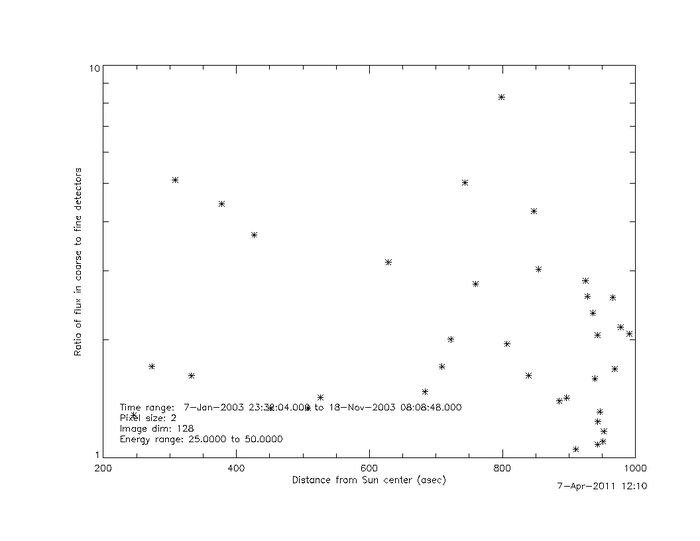
The ratio of the extended source to the compact source is shown below for the 25keV-50keV.
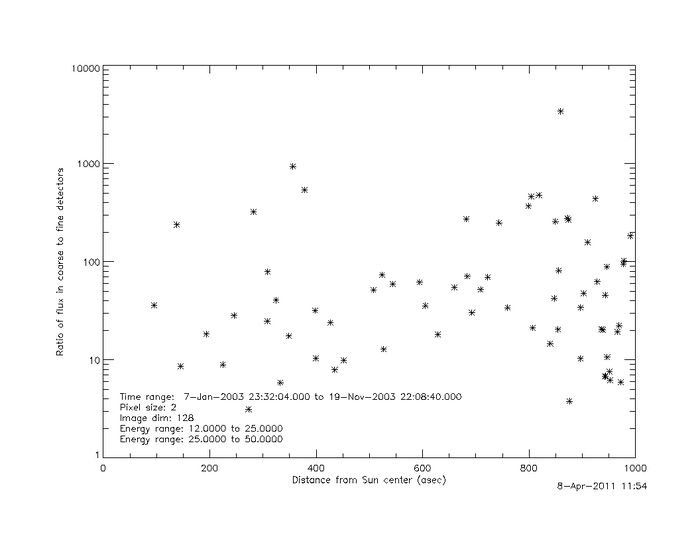
The plot below shows the ratio of the flux in the extended source in the 25keV - 50keV band divided by the flux in the 12kev - 25keV band.
The plots in the 12keV-25KeV range show a scatter of greater than ~7 arcsecs when the compact source is compared to the the total source in ~15% of the cases. In the case of the extended source and the total source there is very little scatter. The extended source seems to account for most of the weight in the location of the total source.
In the case of the 25keV-50keV energy band the differences in the centroids of the source location are smaller. The scatter of the plots show less scatter. Note the change in scale of these plots.
Most of the differences are seen in the location of the compact source compared to the total source show up in the 12keV-25keV energy band.
The final plot shows the flux ratio between the extended source in the 12keV-25keV band and the compact source in the 25keV-50keV band. Most flux ratios are less than 100 times with a few outliers. I am uncertain as to the interpretation past the idea that most flux imaged in the higher energy hard X-Ray footpoints.
Goals
- Trying a refined method of the analysis attempted above
- Plotting versus actual observational distance (arc length of the sun surface as opposed to distance) to create a more accurate profile of distances on the sun.
- Using different detector combinations to isolate the compact and extended sources
- Differentiating the sources by flare size
