Chree Analysis for Flares
From RHESSI Wiki
| Nugget | |
|---|---|
| Number: | 98 |
| 1st Author: | Hugh Hudson |
| 2nd Author: | |
| Published: | 30 March 2009 |
| Next Nugget: | (Nicole) |
| Previous Nugget: | High Temperatures in Active Regions |
| List all | |
Introduction
"Chree analysis," named after Charles Chree, is now normally called "superposed epoch analysis." It is a powerful but tricky device, used effectively by Chree himself but often the source of erroneous conclusions. In this kind of analysis one takes a data series that contains interesting features, and then co-adds short segments of the series using some other source of information to provide a registration index. Thus if one could barely hear Big Ben chime from some distant location, one could just make a recording and then add up the parts centered on the hour as deduced from any other accurate clock. Eventually the noise would average down, and Big Ben's chimes would become strong enough to hear. That is the simple view. Although Chree himself used his method to make many important discoveries about geomagnetism (see Ref. 1), an unwary scientist can easily make a horrible blunder using the technique.
Flare occurrence
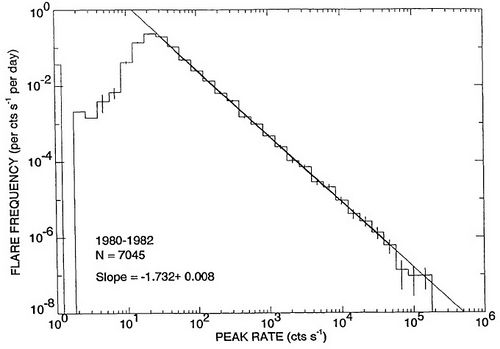
Solar flares occur at odd intervals, but not randomly. There is an extensive literature discussing various aspects of this non-randomness, and Figure 1 (from a paper by Crosby et al.) illustrates on of them, namely the rigorous power-law pattern of flare magnitude. More energetic flares are less numerous, following the precise statistical relationship shown in the Figure. Below the weakest of these events one finds the microflares or even perhaps some of Parker's famous nanoflares.

| RHESSI Nugget Date | 30 March 2009 + |
| RHESSI Nugget First Author | Hugh Hudson + |
| RHESSI Nugget Index | 98 + |