File:Fig06.png
From RHESSI Wiki
Revision as of 21:15, 9 September 2015 by MariaKazachenko (Talk | contribs)
Size of this preview: 800 × 215 pixels
Full resolution (1,508 × 405 pixels, file size: 83 KB, MIME type: image/png)
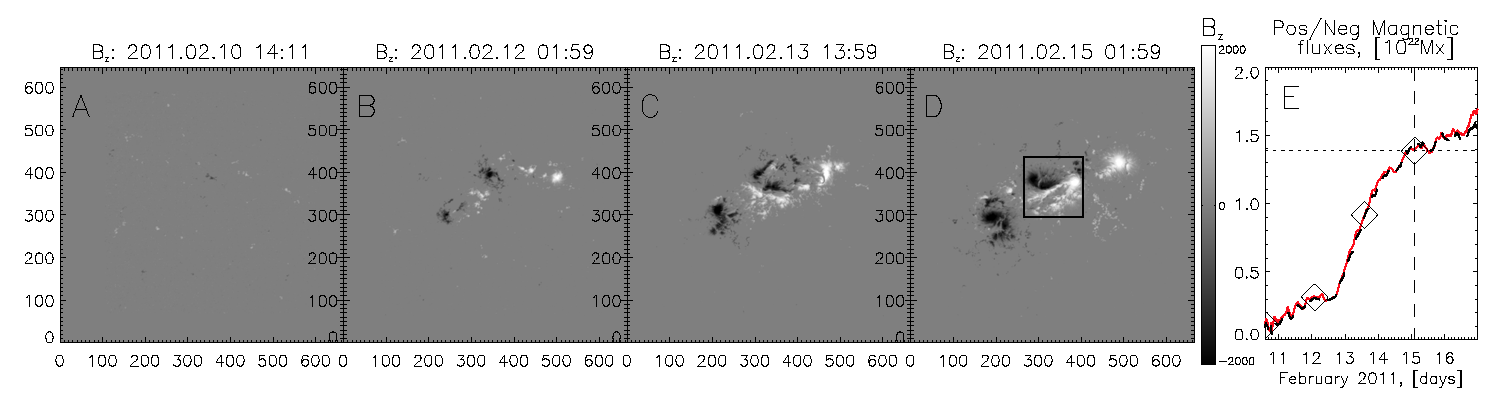
Figure 1: (A)–(D): HMI vertical magnetic field (Bz) maps at four different times of NOAA 11158 evolution. Panel (E): positive/negative vertical magnetic fluxes during the 6-day interval. Diamonds indicate the times of images on the left. An X2.2 flare is marked with the dashed line.
File history
Click on a date/time to view the file as it appeared at that time.
| Date/Time | Thumbnail | Dimensions | User | Comment | |
|---|---|---|---|---|---|
| current | 21:15, 9 September 2015 | 1,508×405 (83 KB) | MariaKazachenko (Talk | contribs) | (Figure 1: (A)–(D): HMI vertical magnetic field (Bz) maps at four different times of NOAA 11158 evolution. Panel (E): positive/negative vertical magnetic fluxes during the 6-day interval. Diamonds indicate the times of images on the left. An X2.2 flare ) |
- Edit this file using an external application (See the setup instructions for more information)
File links
The following page links to this file: