File:Figure3.png
From RHESSI Wiki
Size of this preview: 276 × 599 pixels
Full resolution (691 × 1,500 pixels, file size: 586 KB, MIME type: image/png)
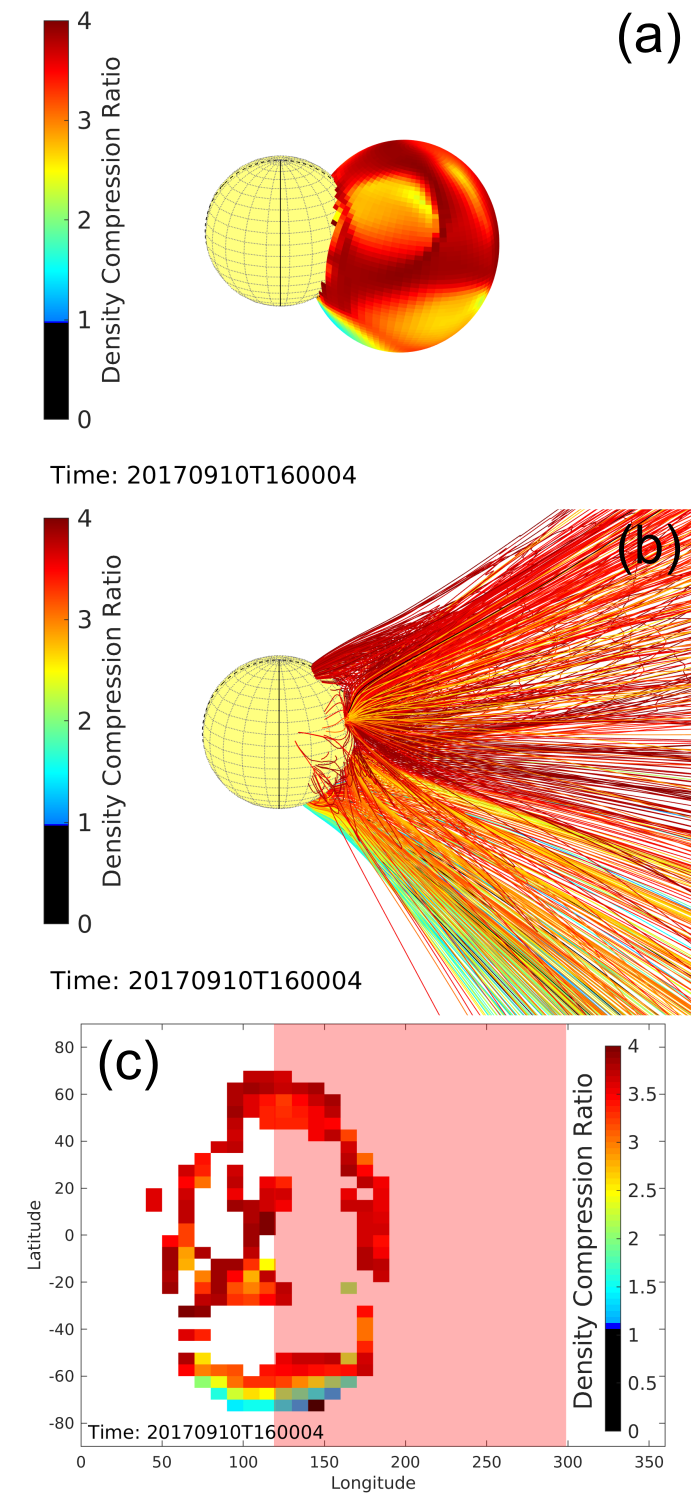
Panels (a) to (c): 3D view of the reconstructed pressure wave and the distributions of the modeled shock parameters along the front surface for the 2017 September 10 event at 16:00 UT. From left to right the panels shows the 3D distributions of the Alfvenic Mach number (MA), the density compression ratio (X), and the magnetic field obliquity with respect to the shock normal (thetaBN).
File history
Click on a date/time to view the file as it appeared at that time.
| Date/Time | Thumbnail | Dimensions | User | Comment | |
|---|---|---|---|---|---|
| current | 21:50, 6 April 2020 | | 691×1,500 (586 KB) | Gshare (Talk | contribs) | (Panels (a) to (c): 3D view of the reconstructed pressure wave and the distributions of the modeled shock parameters along the front surface for the 2017 September 10 event at 16:00 UT. From left to right the panels shows the 3D distributions of the Alfven) |
- Edit this file using an external application (See the setup instructions for more information)
File links
There are no pages that link to this file.