File:Microflare EMT.png
From RHESSI Wiki
Size of this preview: 771 × 599 pixels
Full resolution (799 × 621 pixels, file size: 118 KB, MIME type: image/png)
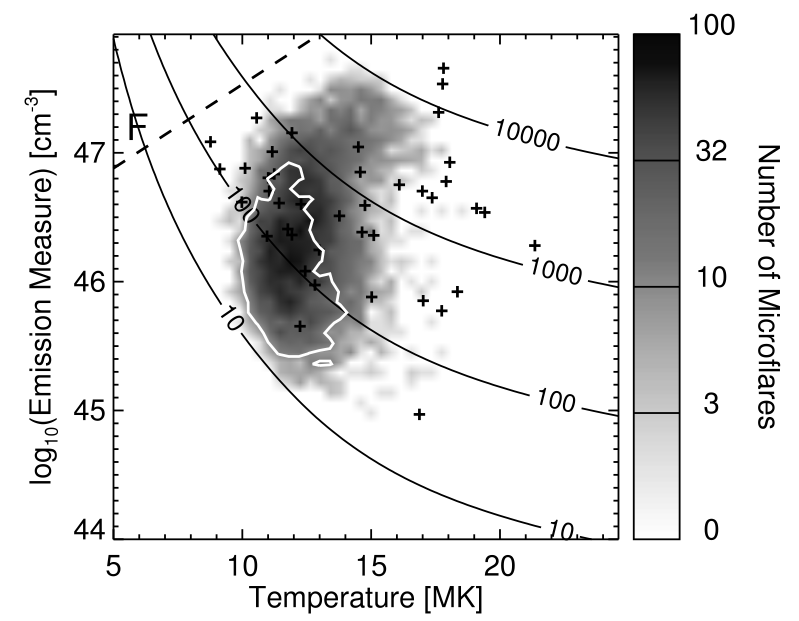
Microflare temperature against emission measure. The correlation
plot is the microflares in this study with black plus signs representing the results of a previous RHESSI study ( Battaglia et al. 2005). The dashed straight line rep- resents the correlation found by Feldman et al. (1996b) from GOES and Yohkoh BCS. The numbered curved lines are of constant count rate per detector in 4 Y 8 keV for the thermal model, as a function of temperature and emission measure. The white contour show the events that have a GOES temperature <10 MK. (From Hannah et al. 2008).
File history
Click on a date/time to view the file as it appeared at that time.
| Date/Time | Thumbnail | Dimensions | User | Comment | |
|---|---|---|---|---|---|
| current | 19:42, 2 March 2009 | | 799×621 (118 KB) | Schriste (Talk | contribs) | ( Microflare temperature against emission measure. The correlation plot is the microflares in this study with black plus signs representing the results of a previous RHESSI study ( Battaglia et al. 2005). The dashed straight line rep- resents the corre) |
- Edit this file using an external application (See the setup instructions for more information)
File links
The following page links to this file: