Non-Maxwellian Diagnostics from SDO/EVE Spectra of an X-class Flare
From RHESSI Wiki
| Nugget | |
|---|---|
| Number: | 317 |
| 1st Author: | Jaroslav Dudik |
| 2nd Author: | |
| Published: | 19 February 2018 |
| Next Nugget: | Homologous CME/flares from AR 12371 |
| Previous Nugget: | Joint MinXSS and RHESSI Flare X-ray Spectra between 1 and 15 keV, MinXSS and RHESSI measure flare spectra over 1-15 keV |
| List all | |

Figure 1: The X5.4 flare of 2012 March 07. Panels (a) and (b) show the GOES X-ray flux and its derivative, respectively. The vertical blue line shows the period selected as for obtaining the background EVE spectrum, while the red vertical line denotes the flare peak. Panels (c)-(e) show the evolution of the flare, as observed by the 94 Â channel of the Atmospheric Imaging Assembly (AIA) instrument onboard the SDO. From (Ref. [4]).

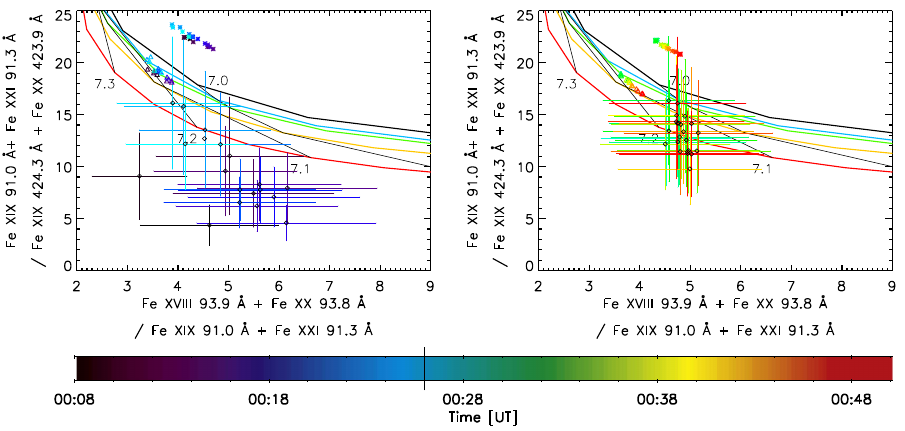
Figure 2: Results of the diagnostics of the kappa-distributions over the early and impulsive phase of the flare until the peak at 00:25 UT (left) and during the onset of the gradual phase starting from 00:25 UT (right). Observed line ratios are shown by diamonds together with the respective error-bars, while the theoretical ratios are plotted by full lines, where black stands for Maxwellian (kappa equal to infinity), green for kappa=5, orange for kappa=3, and red for kappa=2. Asterisks and triangles stand for the predicted ratios given the DEMs derived from a range of Fe X-XXIV lines. From (Ref. [4]).
Facts about Non-Maxwellian Diagnostics from SDO/EVE Spectra of an X-class FlareRDF feed
| RHESSI Nugget Date | 19 February 2018 + |
| RHESSI Nugget First Author | Jaroslav Dudik + |
| RHESSI Nugget Index | 317 + |