RHESSI's Tenth Anniversary
From RHESSI Wiki
RHESSI's Scientific Legacy
February 5, 2012, marks the 10the anniversary of RHESSI's launch. At this time, it seems appropriate to review the scientific achievements to date, and here I offer a personal top-ten list of the iconic figures that I think will constitute RHESSI's legacy. A much more comprehensive review of RHESSI's scientific achievements can be found in the recently published Space Science Review (Vol. 159, Issue 1-4) - High-Energy Aspects of Solar Flares: A RHESSI-inspired monograph.
First of all, it is important to remember that RHESSI was designed to combine both X-ray and gamma-ray imaging spectroscopy in a single instrument with the stated goal of investigating particle acceleration and energy release in solar flares. It is natural to breakdown the scientific results relating to this goal into three areas - those relating to the nonthermal electrons that produce the harder X-ray and gamma-ray continuum emissions, those relating to the energetic ions that produce gamma-ray emissions, and those relating to the hot thermal plasma that produces the softer X-ray emission in the lower end of RHESSI's energy coverage down to ~3 keV. I will consider results in these three areas as they reflect the importance in establishing RHESSI's unique contributions to understanding flare energy release and particle acceleration. In addition, this list would be incomplete without acknowledging the importance of RHESSI's serendipitous contributions to other aspects of solar physics (oblateness), to astrophysics (magnetars), and to Earth sciences (terrestrial gamma-ray flashes).
Discovery of Gamma-ray Footpoint Structures
RHESSI has made detailed images of gamma-rays emitted by solar flares. This had never been done before, and it showed that the gamma-ray sources tend to have a double-footpoint structure as do hard X-rays, but (significantly) at different locations (Hurford et al. 2003, 2006). Smith et al. (2003) were also able to show, from the Doppler shift of several gamma-ray lines, that the magnetic field lines down which the emitting ions were traveling had to be tilted from the vertical at an angle of some 30 to 40 degrees. This result combined with the detection of gamma-ray footpoint emission shows clearly that the ions must have been accelerated over a relatively small volume in the corona, in the primary flare energy source, rather than over a broad area at a shock front propagating far from the flare.
Hurford, G. J., Schwartz, R. A., Krucker, S., Lin, R. P., Smith, D. M., & Vilmer, N. 2003, "First Gamma-Ray Images of a Solar Flare," ApJ, 595, L77.
Hurford et al. 2006, "Gamma-Ray Imaging of the 2003 October/November Solar Flares," ApJ, 644: L93–L96.
Smith et al., 2003, High-resolution Spectroscopy of Gamma-ray Lines from the X-class Solar Flare of 2003 July 23, ApJ., 595, L81.
Energy Content & Spectrum of Flare Energetic Electrons
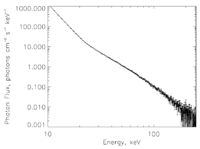
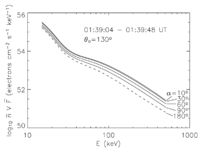
RHESSI’s uniquely high energy resolution (~1 keV FWHM is sufficient to resolve the steep high energy fall-off of hot flare thermal continuum, allowing the precise determination of the energy above which the hard X-ray emission must be non-thermal (Holman et al 2011). For intense solar flares, RHESSI‘s measurements of the hard X-ray continuum are the best ever obtained from an astrophysical source, precise enough for model-independent deconvolution (using powerful mathematical techniques developed for RHESSI observations, e.g., Kontar et al, 2011) to obtain the spectrum of the bremsstrahlung-emitting source electrons. For flare hard X-ray spectra that showed flattening at low energies, the derived electron source spectra appear to show a roll-off around 20 - 40 keV (Kasparova et al., 2005), but after correcting for albedo (the Compton scattering of the source hard X-rays by the solar photosphere), using a newly-developed Green’s function method (Kontar et al 2006), all the derived source electron power-law spectra extend with no roll-off down to <~20 keV and sometimes as low as ~12 keV (see also Sui et al, 2005, 2007), where the hot flare thermal emission dominates. This implies that the source energetic electrons must contain a large fraction of the energy released in many flares.
Holman et al 2011, Space Sci. Rev., 159, 107. Kasparova et al., 2005, Sol. Phys., 232, 63. Kontar et al 2006, Astro. Astrophys. 446, 1157. Kontar et al, 2011, Space Sci. Rev. , 159, 301. Massone et al, 2004, Astrophys. J., 613, 1233. Sui et al, 2005, Astrophys. J. 626, 1102. Sui et al, 2007, Astrophys. J. , 670, 862.
Double Coronal X-ray Sources
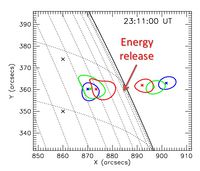
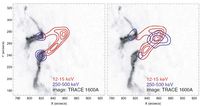
The detection of twin coronal X-ray sources, one at the top and the other above the top of the flare loops. For both sources, higher energy and, therefore, higher temperature emission is shifted toward the region between the sources. This provided the strongest evidence yet for energy release in the corona between the two sources as indicated in the figure. Several other similar events have been reported, e. g. Liu and Petrosian, but it is not known how common this phenomenon might be.
Sui and Holman, 2003, Evidence for the Formation of a Large-Scale Current Sheet in a Solar Flare, ApJ, 596, L251-L254.
Initial downward motion of X-ray sources
Sui and Holman (2003) also reported the initial downward motion of the coronal X-ray source prior to the previously reported continuous upward motion. This was further detailed by Sui et al. (2004), where it was shown that the rate of altitude increase correlated with the hard X-ray flux suggesting that it was related to the energy release rate. This initial downward motion has been seen now in other flares (e.g. Ji et al. 2008) and at other wavelengths, and it appears to be associated with the propagation of reconnection along flare ribbons, but its interpretation is still unclear.
Sui, Holman, & Dennis, 2004, Evidence for Magnetic Reconnection in Three Homologous Solar Flares Observed by RHESSI, Ap. J., 612, 546.
Ji, Haisheng; Wang, Haimin; Liu, Chang; Dennis, Brian R., 2008, A Hard X-Ray Sigmoidal Structure during the Initial Phase of the 2003 October 29 X10 Flare, ApJ 680, 734.
Location of Superhot X-ray source
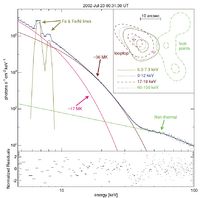
Caspi and Lin (2010) reported two spatially distinct isothermal coronal X-ray sources during the 2002 July 23 X4.8 flare. One source had a temperature of >30 MK and the second, at a lower altitude, had a lower temperature of <~25 MK. They claim that the super-hot source location and its presence at the flare onset — in the absence of HXR footpoint emission — point to a coronal origin for the >30 MK plasma, while the <25 MK plasma originates primarily from chromospheric evaporation. The super-hot and hot plasmas thus arise from fundamentally different physical processes.
Caspi, A. and Lin , R. P., 2010,RHESSI Line and Continuum Observations of Super-hot Flare Plasma, ApJ., 725, L161.
Microflares and the Quiet Sun
RHESSI could readily observe both hard and soft X-rays from microflares, determining both spectrum and location. The figure shows the solar coordinates of some 25,000 of them. Their distribution in space shows that they all come from active regions within the active North and South latitude bands. This establishes conclusively that flares, microflares, or nanoflares - if they resemble flares - do not heat the quiet corona. Related to this, RHESSI has established the lowest upper limits on quiet-Sun hard X-ray emission. This could come from a variety of sources, but again nanoflares would be an intriguing possibility.
Christe, S.; Hannah, I. G.; Krucker, S.; McTiernan, J.; Lin, R. P., 2008, RHESSI Microflare Statistics. I. Flare-Finding and Frequency Distributions, ApJ., 677, 1385.
Hannah, I. G.; Christe, S.; Krucker, S.; Hurford, G. J.; Hudson, H. S.; Lin, R. P., 2008, RHESSI Microflare Statistics. II. X-Ray Imaging, Spectroscopy, and Energy Distributions, ApJ., 677, 704.
Hannah, I. G.; Hudson, H. S.; Hurford, G. J.; Lin, R. P., 2010, Constraining the Hard X-ray Properties of the Quiet Sun with New RHESSI Observations, ApJ., 724, 487.
Coincidence of flare impulsive phase with CME acceleration
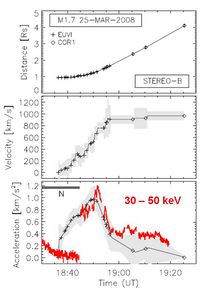
Temmer et al. (2008, 2010) studied three fast CMEs seen close to the limb with STEREO/EUVI and COR1 and obtained the full CME kinematics of the impulsive acceleration phase up to ~4 solar radii. They find that the CME acceleration profile and the flare energy release as evidenced in the RHESSI hard X-ray flux evolve in a highly synchronized manner for all three events studied (as shown in the figure for one event), implying that CME acceleration and electron acceleration are correlated and related to the energy release rate.
Temmer, M.; Veronig, A. M.; Vršnak, B.; Rybák, J.; Gömöry, P.; Stoiser, S.; Maričić, D., 2008, Acceleration in Fast Halo CMEs and Synchronized Flare HXR Bursts, ApJ, 673, 95.
Temmer, M.; Veronig, A. M.; Kontar, E. P.; Krucker, S.; Vršnak, B., 2010, Combined STEREO/RHESSI Study of Coronal Mass Ejection Acceleration and Particle Acceleration in Solar Flares, ApJ, 712, 1410.
Photosphere as a Compton or dentist's mirror
With RHESSI's excellent spectral resolution, we can use the albedo contribution to the measured hard X-ray flux to our advantage. Kontar and Brown (2006) showed that, by considering the Sun’s surface to act as a “Compton mirror,” we can look at the emitting electrons both directly and from behind the source, providing vital information on the directionality of the propagating particles. Using this technique, they determined simultaneously the electron spectra of downward- and upward-directed electrons for two solar flares observed with RHESSI. The results reveal surprisingly near-isotropic electron distributions, which contrast strongly with the expectations from the standard model that invokes strong downward beaming, including a collisional thick-target model. Some would say that this result provides strong evidence against electron beam models in that simple particle beams aren't present in the energetically important particle distributions.
Kontar, E. P. and Brown, J. C., 2006, STEREOSCOPIC ELECTRON SPECTROSCOPY OF SOLAR HARD X-RAY FLARES WITH A SINGLE SPACECRAFT, ApJ., 653, L149.
Nonthermal Emissions from the Corona
RHESSI's excellent energy resolution in combination with its imaging capability made it for the first time possible to cleanly measure nonthermal emissions from the corona (e.g. Battaglia & Benz 2006). These observations reveal that a non-thermal component is present in essentially all flares (Krucker & Lin 2008). RHESSI discovered that coronal nonthermal emissions are found in a large variety of associations such as in the pre-flare phase (Lin et al. 2003), in the absence of footpoint emission (Veronig & Brown 2004), associated with jets (Bain et al. 2009), with Coronal Mass Ejections (Krucker et al. 2007), and also in the gamma-ray range (Krucker et al. 2008). These observations indicate that a significant fraction of the total accelerated electrons are in the corona at one time, clearly favoring an acceleration site in the corona.
Bain & Fletcher 2009, A&A, 466, 713.
Battaglia & Benz 2007, A&A, 466, 713.
Krucker et al. 2007, ApJ, 595, L69.
Krucker & Lin 2008, ApJ, 673, 1181.
Krucker S, Hurford GJ, MacKinnon AL, Shih AY, Lin RP, 2008, Coronal gamma-ray bremsstrahlung from solar flare-accelerated electrons, ApJ, 678, L63.
Lin et al. 2003, ApJ, 595, L69.
Veronig & Brown 2004, ApJ, 603, L117.
Imaging the Acceleration Region: Bulk Energization
While non-thermal coronal sources are found to be ubiquitous, some flares show extraordinarily intense emission. The famous Masuda flare is the best-known example. RHESSI revealed that such coronal sources outline the acceleration region. The extreme brightness suggests that all electrons within the source are accelerated in a bulk energization process (Krucker et al. 2010, Ishikawa et al. 2011). Simultaneous microwave observations indicate that the energy in accelerated electrons at the peak of the event is of the same order magnitude as the magnetic energy (i.e. plasma beta near unity). This indicates an extreme efficient conversion of magnetic energy into kinetic energy. Although these extreme events are rare, they provide crucial tests of the maximal efficiency of different acceleration models.
Ishikawa, S.; Krucker, Säm; Takahashi, T.; Lin, R. P., 2011, On the Relation of Above-the-loop and Footpoint Hard X-Ray Sources in Solar Flares, 737, 48.
Krucker, Säm; Hudson, H. S.; Glesener, L.; White, S. M.; Masuda, S.; Wuelser, J.-P.; Lin, R. P., 2010, Measurements of the Coronal Acceleration Region of a Solar Flare, ApJ, 714, 1108.
HXR Flare Ribbons
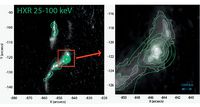
With RHESSI’s unprecedented (2 arcsec) spatial resolution, detailed HXR imaging of flare ribbons finally became possible. This showed elongated structures along the ribbon that closely match the white light sources, but only partially match the EUV sources (Liu et al. 2007, Dennis & Pernak 2009, Krucker et al. 2011). The width of these sources, however, was often unresolved even by RHESSI, yielding an upper limit of ~1 arcsec for the dimension. This indicates that the number density of precipitating electrons is even larger than previously thought. These observations challenge our current understanding of the standard flare model and provide crucial new insights to understand electron acceleration and transport.
Liu, Lee, Gary, & Wang 2007, ApJ, 658, L127.
Dennis & Pernak 2009, ApJ 698, 2131.
Krucker, Hudson, Jeffrey, Battaglia, Kontar, Benz, Csillaghy, & Lin 2011, Apj, 739, 96.
Broadened 511-keV positron annihilation line
Measurement of a surprisingly broad 511-keV positron annihilation line indicating that the temperature of the ion interaction region was above 105, K. Later, in some flares, the width of the line narrows to ∼1 keV consistent with annihilation in ionized H at < 104K and ≥1015 cm-3. The full implications of these observations are still unclear but they bring into question the energy source of the heating and if the ions alone can produce such a highly dynamic flaring atmosphere at chromospheric densities that can reach transition-region temperatures, then cool to less than 104 K in minutes while remaining highly ionized.
Share et al. (2004) RHESSI e+ -- e- ANNIHILATION RADIATION OBSERVATIONS: IMPLICATIONS FOR CONDITIONS IN THE FLARING SOLAR CHROMOSPHERE Gerald H. Share, Ronald J. Murphy, David M. Smith, Richard A. Schwartz, and Robert P. Lin, ApJ, 615:L169–L172, 2004.
Solar Oblateness
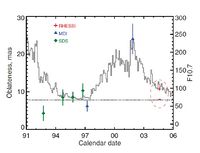
Measurements of the solar diameter using RHESSI's Solar Aspect System showed unexpectedly large flattening compared to what is predicted from solar rotation. Fivian et al. (2008) were able to show that this effect was due to magnetic elements in the enhanced network producing emission preferentially at lower latitudes. Once this contribution was removed, the corrected oblateness of the nonmagnetic Sun was determined to be 8.01 +/- 0.14 milli–arc seconds, which is near the value expected from rotation of 7.8 milli–arc seconds, or ~0.001%. This result explained the variation that had been reported with solar cycle and is the most accurate measure of the true oblateness ever made.
Fivian, Martin D.; Hudson, Hugh S.; Lin, Robert P.; Zahid, H. Jabran, 2008, A Large Excess in Apparent Solar Oblateness Due to Surface Magnetism, Science, 322, 560.
Magnetar timing and spectroscopy
RHESSI serendipitously detected a huge flare from the soft-gamma-ray repeater (SGR) 1806–20 that was just 5.25° from the Sun at the time of the observations. SGRs are thought to be magnetar - isolated, strongly magnetized neutron stars with teragauss exterior magnetic fields and even stronger fields within, making them the most strongly-magnetized objects in the Universe. In the first 0.2 s, the flare released as much energy as the Sun radiates in a quarter of a million years. This observation suggested that a significant fraction of the mysterious short-duration gamma-ray bursts may come from similar extragalactic magnetars.
Later work by Watts and Strohmayer (2006) revealed quasi-periodic oscillations (QPOs) in the RHESSI timing data directly related to the "ringing" modes of the neutron star and interpreted as arising from vibrations in the neutron star crust offers a novel means of testing the neutron star equation of state, crustal breaking strain, and magnetic field configuration.
Hurley et al., 2005, An exceptionally bright flare from SGR 1806−20 and the origins of short-duration gamma-ray bursts, Nature, 434, 1098.
Watts, A. L. and Strohmayer, T. E., 2006, Detection with RHESSI of High-Frequency X-Ray Oscillations in the Tail of the 2004 Hyperflare from SGR 1806-20, ApJ., 637, L117.
Terrestrial Gamma-ray Flashes (TGFs)
RHESSI has detected over 1000 TGFs that were first discovered with BATSE on the Compton Gamma Ray Observatory and are thought to be related to terrestrial lightening. RHESSI showed that TGFs are much more common and luminous than previously thought, and that they extend up to gamma-ray energies beyond 20 MeV, with just the spectral shape predicted by the relativistic runaway model. RHESSI's observations also show that the TGFs come from altitudes of around 15 km, and that they are associated with intra-cloud lightning and not cloud-to-ground lightning or sprites.
Smith, D. M., L. I. Lopez, R. P. Lin, and C. P. Barrington-Leigh, 2005, Terrestrial gamma-ray flashes observed up to 20 MeV, Science, 307, 1085–1088.
Dwyer and Smith, 2005, A comparison between Monte Carlo simulations of runaway breakdown and terrestrial gamma-ray flash observations, GRL, 32, L22804.

