Solar flare hard X-rays from the anchor points of an eruptive filament
From RHESSI Wiki
| Nugget | |
|---|---|
| Number: | 450 |
| 1st Author: | Muriel STIEFEL |
| 2nd Author: | |
| Published: | May 15, 2023 |
| Next Nugget: | TBD |
| Previous Nugget: | Did a Solar Flare Accelerate all the Ambient Electrons in the Coronal Acceleration Region?... |
| List all | |
Contents |
Introduction
The hard X-ray imaging spectrometer (STIX) on the satellite Solar Orbiter observes solar flares in the hard X-ray energy range carrying on the observations of its predecessor RHESSI. This Nugget gives an overview of the analysis of a GOES M1.8 flare as reported in Ref. [1]. The flare was jointly observed by many space observatories: AIA/SDO, XRT/Hinode, EIS/Hinode, IRIS and of course STIX on board Solar Orbiter. Making this flare special is that we report four individual sources observed at nonthermal hard X-ray energies.
Method
We did a multi-wavelength analysis of the flare in the EUV and X-ray energy range using the detectors and satellites listed above. STIX uses an indirect imaging technique providing us with the visibilities - the Fourier components of the image of a flaring X-ray source. The reconstruction of an actual image (ie, the conversion back from Fourier space to a normal [x,y] depiction of the image) is done on Earth using various different imaging algorithms (e.g. Back-projection, forward-fitting, MEM_GE; see Ref [2]).
The Flare
We analyzed SOL2021-09-23T15:28, an M1.8 flare. This was the most powerful flare jointly observed by the Hinode, SDO and Solar Orbiter spacecraft in the time range February to October 2021. The detailed study of this flare was motivated by the observation of four individual sources on the STIX images in the nonthermal energy range, shown from 22 to 28 keV. In the two upper images of Figure 1 the contours show the reconstructed STIX images during the peak of the nonthermal energy range. The further analysis of this flare was driven by the goal to understand the role of these four sources especially in the context of the standard model for solar flares.

To understand the geometry of the flare, we analyzed the thermal sources observed by XRT, EIS, AIA and STIX (5-9 keV) during the peak time of the thermal energy. The two images at the bottom of Figure 1 compare the thermal sources as seen from Earth perspective point with XRT, EIS and AIA 1600 Å and STIX view point with STIX and AIA 1600 Â (reprojected). We clearly see a flare loop in the EIS and XRT filters and in the thermal energy range 5-9 keV of STIX connecting the two footpoints visible in AIA 1600 Å. These two footpoints correspond to "Fp 2" and "Fp 3" as noted in the upper left image, showing the well-known standard model for solar flares with the flare loop and its footpoints.
To explore further the similarities and differences among the four sources, we compared the time evolution of the intensities measured by AIA and STIX at the location of each. Figure 2 shows the comparison between the individual sources and detectors. We can observe striking differences between the outer sources (Fp 1 and Fp 4) and the inner sources (Fp 2 and Fp 3). While the outer sources increase and decrease rapidly, the inner sources have longer decay times.

Conclusions
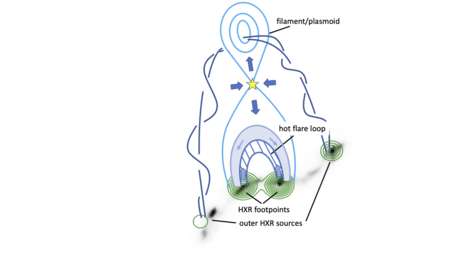
From the observations we can clearly recognise that the inner sources (Fp 2 and Fp 3) show similar behaviour and are the footpoints of a flare loop as known from the standard model for solar flares. The outer sources (Fp 1 and Fp 4) show different behaviour compared to the inner sources. Combining our observations outlined above with further studies (see Ref. [1]) of the CME and the measurement of the Doppler velocities, we deduce that the outer sources are likely to be the anchor points of an eruptive filament. The outer sources are produced by flare-accelerated electrons that precipitate down the filament and emit Bremsstrahlung in the chromosphere. Figure 3 shows a cartoon of our results, combining the standard model for solar flares with the measurements of the flare presented here. Hard X-ray sources of an eruptive filament were already predicted by Ref. [3]. Ref. [4] reports similar observations for a flare in the microwave range making our observations the first report of such outer anchor points in the hard X-ray range.
References
[1] "Solar flare hard X-rays from the anchor points of an eruptive filament"
[2] "STIX imaging I -- Concept"
[3] "Hot-Plasma Ejections Associated with Compact-Loop Solar Flares"
| RHESSI Nugget Date | 15 May 2023 + |
| RHESSI Nugget First Author | Muriel STIEFEL + |
| RHESSI Nugget Index | 450 + |
