File list
From RHESSI Wiki
This special page shows all uploaded files. By default the last uploaded files are shown at top of the list.
A click on a column header changes the sorting.| Name | User | Size | Description | Versions | |
|---|---|---|---|---|---|
| 14:04, 23 September 2018 | Icon332.png (file) | Hhudson | 259 KB | 1 | |
| 13:58, 23 September 2018 | 332f4.JPG (file) | Hhudson | 75 KB | 2 | |
| 13:55, 23 September 2018 | 332f3.png (file) | Hhudson | 14 KB | 4 | |
| 13:42, 23 September 2018 | Equation.JPG (file) | Hhudson | 35 KB | 1 | |
| 13:39, 23 September 2018 | 332f2.jpg (file) | Hhudson | 252 KB | 1 | |
| 11:47, 23 September 2018 | 322f2.jpg (file) | Hhudson | 252 KB | 1 | |
| 11:43, 23 September 2018 | 322f1.gif (file) | Hhudson | 803 KB | 2 | |
| 21:47, 21 September 2018 | Mem_njit_FW50M_dLvsdD_20-30.jpg (file) | Bdennis | 262 KB | (Changes in position (DeltaD) and length (DeltaL measured at 50% of the peak intensity) between 20 to 30 keV for the coronal sources for the 6 flares and 12 time intervals used in the study.) | 2 |
| 21:29, 21 September 2018 | Mem_njit_event3_dist.jpg.jpg (file) | Bdennis | 156 KB | (Energy dependence of the distance, D, between the peak in coronal flux in the 20-22 keV image and the peak at other energies. The solid lines show linear fits to the data points from 10 to 20 keV and 20 to 30 keV, and the indicated values of DeltaD are th) | 1 |
| 21:18, 21 September 2018 | Mem_njit_event3_fwhm_arc2.jpg (file) | Bdennis | 297 KB | (Coronal source length measured along the loop spine plotted vs. photon energy. The lengths were determined as the distances between the positions at which the intensity along the arc dropped to 75% (blue), 50% (orange), and 20% (red) of the peak value in ) | 1 |
| 21:06, 21 September 2018 | Mem_njit_event3_gaussfit_arc2.jpg (file) | Bdennis | 381 KB | (Normalized X-ray intensity vs. distance measured along the loop spine that pass through the coronal source peak location at each energy Color-coded points for each energy show the intensities at each pixel along the arc in the image. The curves are the su) | 1 |
| 20:27, 21 September 2018 | Im_15april2002_000000to000500_hsi_memnjit_12to25to50kev_d3456.jpg (file) | Bdennis | 420 KB | (RHESSI 12 - 25 keV image (color-coded according to the color bar in units of photons cm^2 s^1 arcsec^2) overlaid with 25 - 50 keV contours (5, 10, 30, 50, 70, and 90% of the peak value) for the 5-min. interval from 00:00 to 00:05 UT made using the MEM NJI) | 1 |
| 11:15, 21 September 2018 | 332f4.png (file) | Hhudson | 12 KB | 1 | |
| 10:50, 21 September 2018 | Eq.png (file) | Hhudson | 11 KB | 1 | |
| 18:42, 20 September 2018 | 332f2.png (file) | Hhudson | 69 KB | 1 | |
| 18:41, 20 September 2018 | 332f1.png (file) | Hhudson | 112 KB | 1 | |
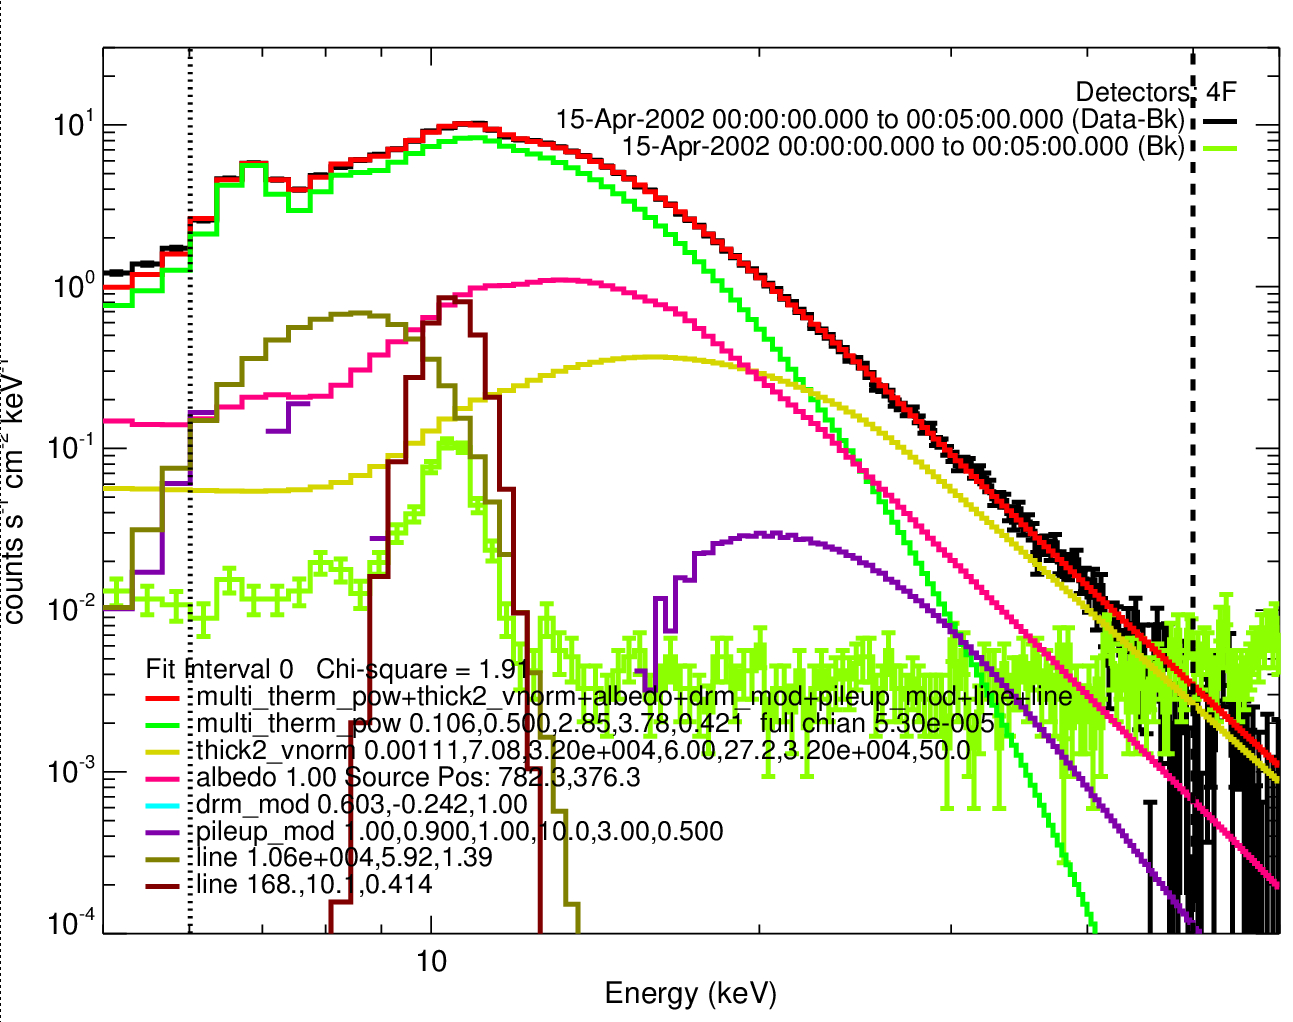
| 22:24, 17 September 2018 | Sp_15april2002_000000to000500_hsi_mtpow_thick2_albedo_5to60keV_d4f.jpg (file) | Bdennis | 604 KB | (RHESSI count flux spectrum for the five-minute time interval shown in Figure 1. The black histogram is the background-subtracted count flux in the front segment of Detector #4. The red histogram is the function that was fitted to the data between 6 and 5) | 1 |
| 22:00, 17 September 2018 | Lc_15April2002_hsi_ql.jpg (file) | Bdennis | 299 KB | (RHESSI light curves for the flare on 15 April 2002. The color-coded curves are for the five indicated energy ranges. Counts from the front segments of all detectors except for detectors #2 and #7 were summed and divided by the summed live times and the t) | 1 |
| 12:33, 27 August 2018 | 53f3.png (file) | Hhudson | 59 KB | 1 | |
| 12:31, 27 August 2018 | 53f2.png (file) | Hhudson | 31 KB | 1 | |
| 12:31, 27 August 2018 | 53f1.png (file) | Hhudson | 53 KB | 1 | |
| 12:11, 27 August 2018 | 35f3.png (file) | Hhudson | 43 KB | 1 | |
| 12:11, 27 August 2018 | 35f2.png (file) | Hhudson | 208 KB | 1 | |
| 12:10, 27 August 2018 | 35f1.png (file) | Hhudson | 50 KB | 1 | |
| 11:59, 27 August 2018 | 57f2.png (file) | Hhudson | 228 KB | 1 | |
| 11:53, 27 August 2018 | 57f3.png (file) | Hhudson | 80 KB | 1 | |
| 11:53, 27 August 2018 | 57f1.png (file) | Hhudson | 42 KB | 1 | |
| 11:43, 27 August 2018 | 58f3.png (file) | Hhudson | 24 KB | 1 | |
| 11:43, 27 August 2018 | 58f2.png (file) | Hhudson | 23 KB | 1 | |
| 11:43, 27 August 2018 | 58f1.png (file) | Hhudson | 60 KB | 1 | |
| 10:26, 27 August 2018 | 78f3.png (file) | Hhudson | 67 KB | 1 | |
| 10:26, 27 August 2018 | 78f2.png (file) | Hhudson | 66 KB | 1 | |
| 10:26, 27 August 2018 | 78f1.png (file) | Hhudson | 47 KB | 1 | |
| 10:07, 27 August 2018 | 38f3.png (file) | Hhudson | 46 KB | 1 | |
| 10:07, 27 August 2018 | 38f2.png (file) | Hhudson | 131 KB | 1 | |
| 10:06, 27 August 2018 | 38f1.png (file) | Hhudson | 35 KB | 1 | |
| 09:54, 27 August 2018 | 69f3.png (file) | Hhudson | 48 KB | 1 | |
| 09:53, 27 August 2018 | 69f2.png (file) | Hhudson | 66 KB | 1 | |
| 09:53, 27 August 2018 | 69f1.png (file) | Hhudson | 47 KB | 1 | |
| 09:47, 27 August 2018 | 74f3.png (file) | Hhudson | 21 KB | 1 | |
| 09:47, 27 August 2018 | 74f2.png (file) | Hhudson | 37 KB | 1 | |
| 09:46, 27 August 2018 | 74f1.png (file) | Hhudson | 57 KB | 1 | |
| 08:24, 27 August 2018 | 37f3.png (file) | Hhudson | 113 KB | 1 | |
| 08:18, 27 August 2018 | 37f2.png (file) | Hhudson | 296 KB | 1 | |
| 07:30, 27 August 2018 | 37f1.png (file) | Hhudson | 228 KB | 1 | |
| 13:40, 24 August 2018 | 36f2.png (file) | Hhudson | 80 KB | 1 | |
| 13:40, 24 August 2018 | 36f1.png (file) | Hhudson | 65 KB | 1 | |
| 13:30, 24 August 2018 | 56f5.png (file) | Hhudson | 64 KB | 1 | |
| 13:30, 24 August 2018 | 56f3.png (file) | Hhudson | 24 KB | 1 | |
| 13:30, 24 August 2018 | 56f2.png (file) | Hhudson | 13 KB | 1 |
First page |
Previous page |
Next page |
Last page |