File list
From RHESSI Wiki
This special page shows all uploaded files. By default the last uploaded files are shown at top of the list.
A click on a column header changes the sorting.| Date | User | Size | Description | Versions | |
|---|---|---|---|---|---|
| 16:11, 29 April 2009 | 100_Icon.jpg (file) | Hhudson | 12 KB | (Reuven Ramaty, from the conference picture of a meeting in Buenos Aires in 1975.) | 1 |
| 16:40, 28 April 2009 | 100_brianbobarnold.jpg (file) | Hhudson | 54 KB | (Three key RHESSI people - Brian Dennis, Bob Lin, and Arnold Benz) | 1 |
| 15:40, 8 May 2009 | 101_sbs1.jpg (file) | Hhudson | 258 KB | (RHESSI Science Nugget 101, Figures 1 and 2) | 1 |
| 19:13, 14 May 2009 | 101_sbs1.png (file) | Schriste | 1.1 MB | 1 | |
| 15:41, 8 May 2009 | 101_sbs2.jpg (file) | Hhudson | 320 KB | (RHESSI Science Nugget 101, Figures 3 and 4) | 1 |
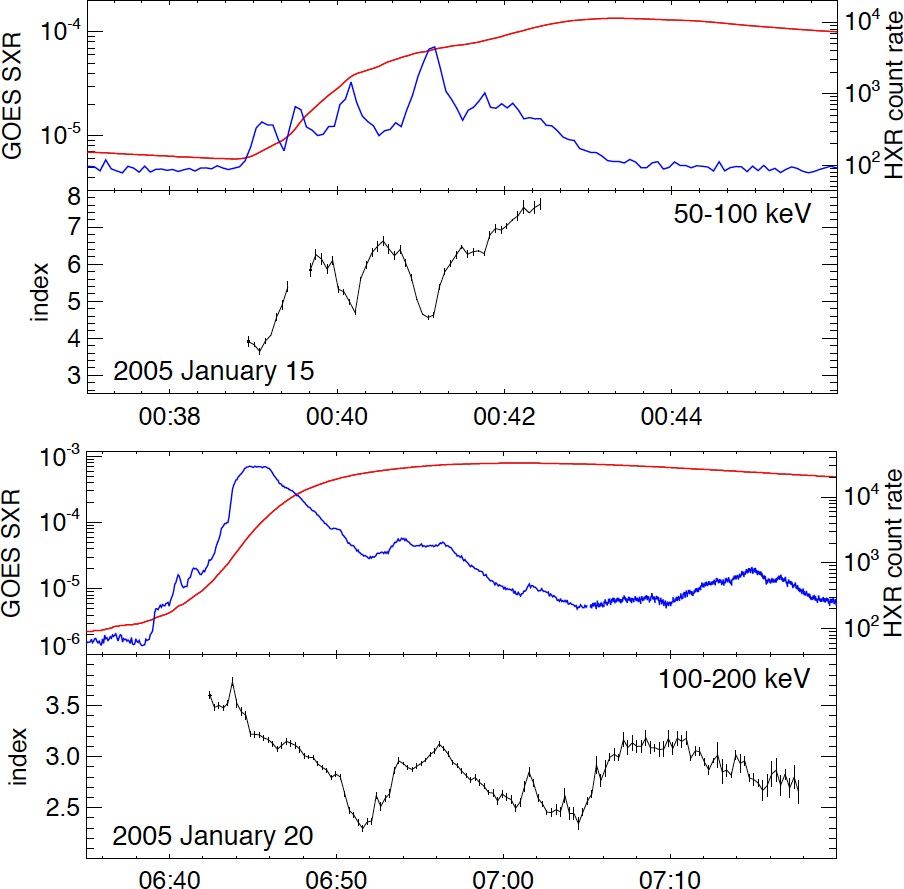
| 01:25, 12 August 2009 | 107-shs_shh.jpg (file) | Hhudson | 139 KB | (Two flares seen in hard X-rays: Upper, the CMEless event of Jan. 15, 2005; lower, the CME event of Jan. 20. Each two-panel plot shows the GOES soft X-ray flux (red) and the RHESSI hard X-ray flux, as indicated, plus the slope of the hard X-ray spectrum. N) | 1 |
| 13:11, 11 August 2009 | 107_durations.jpg (file) | Hhudson | 49 KB | (Comparison of GOES durations for CMEless X-class flares with comparable CME-associated flares, and with all X-class flares.) | 1 |
| 03:34, 17 August 2009 | 108-Fig1.jpg (file) | Hhudson | 79 KB | (Back-projection images from each of RHESSI's nine detectors. This is the raw data from which we construct <i>real</i> images, and just shows that things are working about as expected and that we can in fact image Cycle 24 flares in hard X-rays.) | 1 |
| 03:39, 18 August 2009 | 108-Fig2.jpg (file) | Hhudson | 87 KB | (RHESSI image over 5-10 keV, made a [http://mathworld.wolfram.com/MaximumEntropyMethod.html maximum entropy] algorithm, superposed on a TRACE EUV image from a slightly later time.) | 1 |
| 13:57, 21 August 2018 | 10f1.png (file) | Hhudson | 109 KB | 1 | |
| 14:01, 21 August 2018 | 10f2.png (file) | Hhudson | 62 KB | 1 | |
| 14:02, 21 August 2018 | 10f3.png (file) | Hhudson | 87 KB | 1 | |
| 15:22, 28 September 2009 | 111Icon.jpg (file) | Hhudson | 6 KB | (A five-hour RHESSI integration at 4-8 keV starting some 9 hours after a C-class flare and CME eruption.) | 1 |
| 21:01, 26 September 2009 | 111_fig1.jpg (file) | Hhudson | 41 KB | (EIT difference image (left) and descriptive cartoon (right) for the event of 2002 November 26-28.) | 1 |
| 21:46, 26 September 2009 | 111_fig2.jpg (file) | Hhudson | 60 KB | (Left, an EIT 304 A image showing the loop arcade, with RHESSI source locations at different times shown as dashed contours. Right, a RHESSI image from a five-hour integration. Note that the image scales are a bit different.) | 1 |
| 17:59, 5 October 2009 | 112_RHESSI.jpg (file) | Hhudson | 73 KB | (The RHESSI altitude and velocity, courtesy of Pascal Saint-Hilaire) | 1 |
| 15:20, 6 October 2009 | 112_tle_1.png (file) | Hhudson | 39 KB | (The RHESSI orbital altitude compared with the solar radio flux index F10.7) | 1 |
| 15:23, 6 October 2009 | 112_tle_2.png (file) | Hhudson | 62 KB | (The same data as in Figure 1, but now showing how the <i>time variation</i> of orbital altitude tracks with F107.) | 1 |
| 08:50, 8 November 2009 | 114_Fig1.gif (file) | Hhudson | 167 KB | 1 | |
| 08:52, 8 November 2009 | 114_Fig2.gif (file) | Hhudson | 173 KB | 1 | |
| 08:56, 8 November 2009 | 114_Fig3.gif (file) | Hhudson | 121 KB | 1 | |
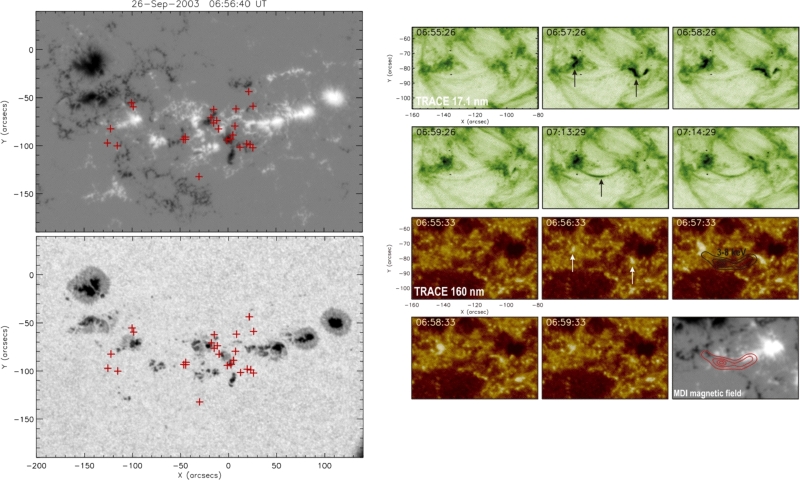
| 01:28, 7 December 2009 | 116_fig1.jpg (file) | Hhudson | 41 KB | 2 | |
| 02:14, 7 December 2009 | 116_fig2.jpg (file) | Hhudson | 41 KB | (The 1600A observations of the flare. The time series at the left shows the UV flux integrated over the image area, and the image at the right shows what it looked like at the peak.) | 1 |
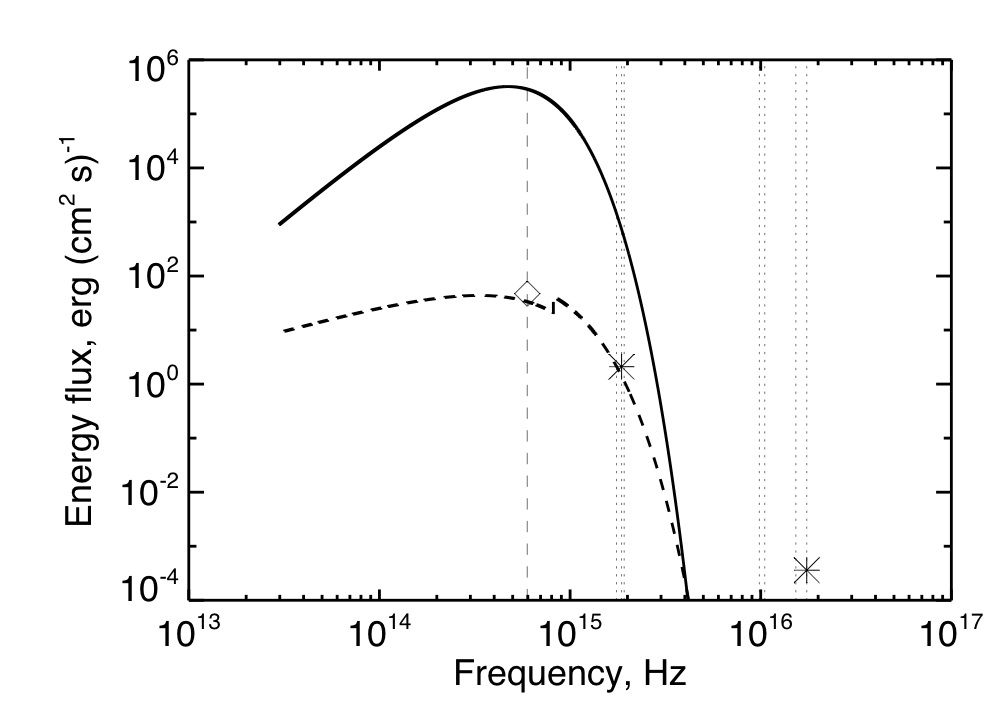
| 02:48, 7 December 2009 | 116_fig3.jpg (file) | Hhudson | 82 KB | (The energy distribution derived from the TRACE images for the impulsive phase of the flare. This is very crude. It represents the photosphere as a blackbody (the solid line), and the flare as a slightly hotter but optically-thin source. This works for 160) | 1 |
| 20:28, 4 January 2010 | 118_fig1.jpg (file) | Hhudson | 101 KB | (The F10.7 index of solar activity, shown as a superposed-epoch analysis of the data since 1947. The points with the range bars show the previous cycle onsets, keyed to the times of maximum just preceding each minimum. The red points are the current data, ) | 1 |
| 20:34, 4 January 2010 | 118_fig2.jpg (file) | Hhudson | 88 KB | 1 | |
| 21:11, 5 January 2010 | 118_fig3.png (file) | Hhudson | 201 KB | (A view of the other side of the Sun, almost, from the STEREO Behind spacecraft. ) | 1 |
| 20:11, 19 March 2014 | 121f1.png (file) | Hhudson | 139 KB | (Overview figure, showing source locations along a general arc connecting regions of opposite polarity in the magnetogram (left panel); the middle and right panels show a TRACE 193 A image and a RHESSI image, respectively, with 3-6 keV and 12-25 keV contou) | 1 |
| 02:45, 13 March 2010 | 123_f1.jpg (file) | Hhudson | 100 KB | (Pretty amazing, says the Publisher!) | 1 |
| 03:46, 13 March 2010 | 123_f2.jpg (file) | Hhudson | 300 KB | (Waiting-time distributions for various satellites observing hard X-rays from solar flares.) | 1 |
| 14:39, 11 April 2010 | 125Fig1.gif (file) | Hhudson | 135 KB | (The original display of the Masuda flare, from the 1994 paper. Note the clean-looking soft X-ray loop with its hard X-ray footpoints.) | 2 |
| 15:24, 11 April 2010 | 125Fig2.gif (file) | Hhudson | 121 KB | (Images of the global corona around the time of the Masuda flare, showing heretofore unremarked trans-equatorial loops.) | 1 |
| 17:25, 25 April 2010 | 126fig1.jpg (file) | Hhudson | 16 KB | (Figure 1: Cross-section of the Sun through its rotation axis, showing its basically circular shape (red) with a small distortion induced by the rotation (blue). The radial scale has been magnified enormously as indicated. The points show actual RHESSI dat) | 1 |
| 20:01, 25 April 2010 | 126fig2.jpg (file) | Hhudson | 68 KB | (Figure 2: Early measurements of the solar oblateness, using both photographic plates and [http://en.wikipedia.org/wiki/Heliometer heliometers]. These early researchers were interested in the relationship between the oblateness and the phase of the solar ) | 1 |
| 20:20, 25 April 2010 | 126fig3.jpg (file) | Hhudson | 66 KB | (Figure 3: The intermediate period of specialized, modern ground-based observations of solar oblateness. The first point on this graph was the revolutionary observation of Dicke & Goldenberg, as reported in [2].) | 1 |
| 20:43, 25 April 2010 | 126fig4.jpg (file) | Hhudson | 82 KB | (Figure 4: The modern data, including the single point thus far published from the RHESSI data. The black lozenges show the continuing ground-based observations from [http://en.wikipedia.org/wiki/Pic_du_Midi_de_Bigorre Pic du Midi]. The green points show t) | 2 |
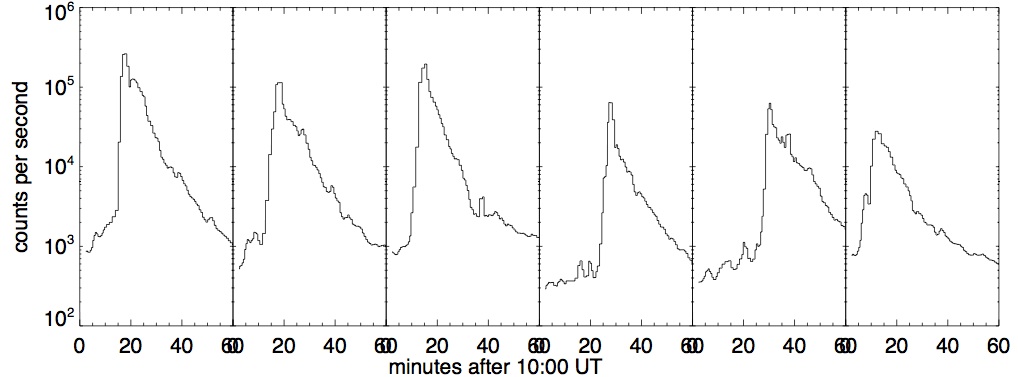
| 02:50, 13 May 2010 | 127fig1.jpg (file) | Hhudson | 39 KB | (Results of the second RHESSI anneal, May 2010.) | 1 |
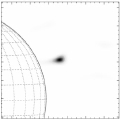
| 12:54, 14 May 2010 | 127fig2a.png (file) | Hhudson | 122 KB | (RHESSI image of a small flare (SOL20020508T19:59) after the successful annealing operation (courtesy Ryan Milligan, GSFC).) | 1 |
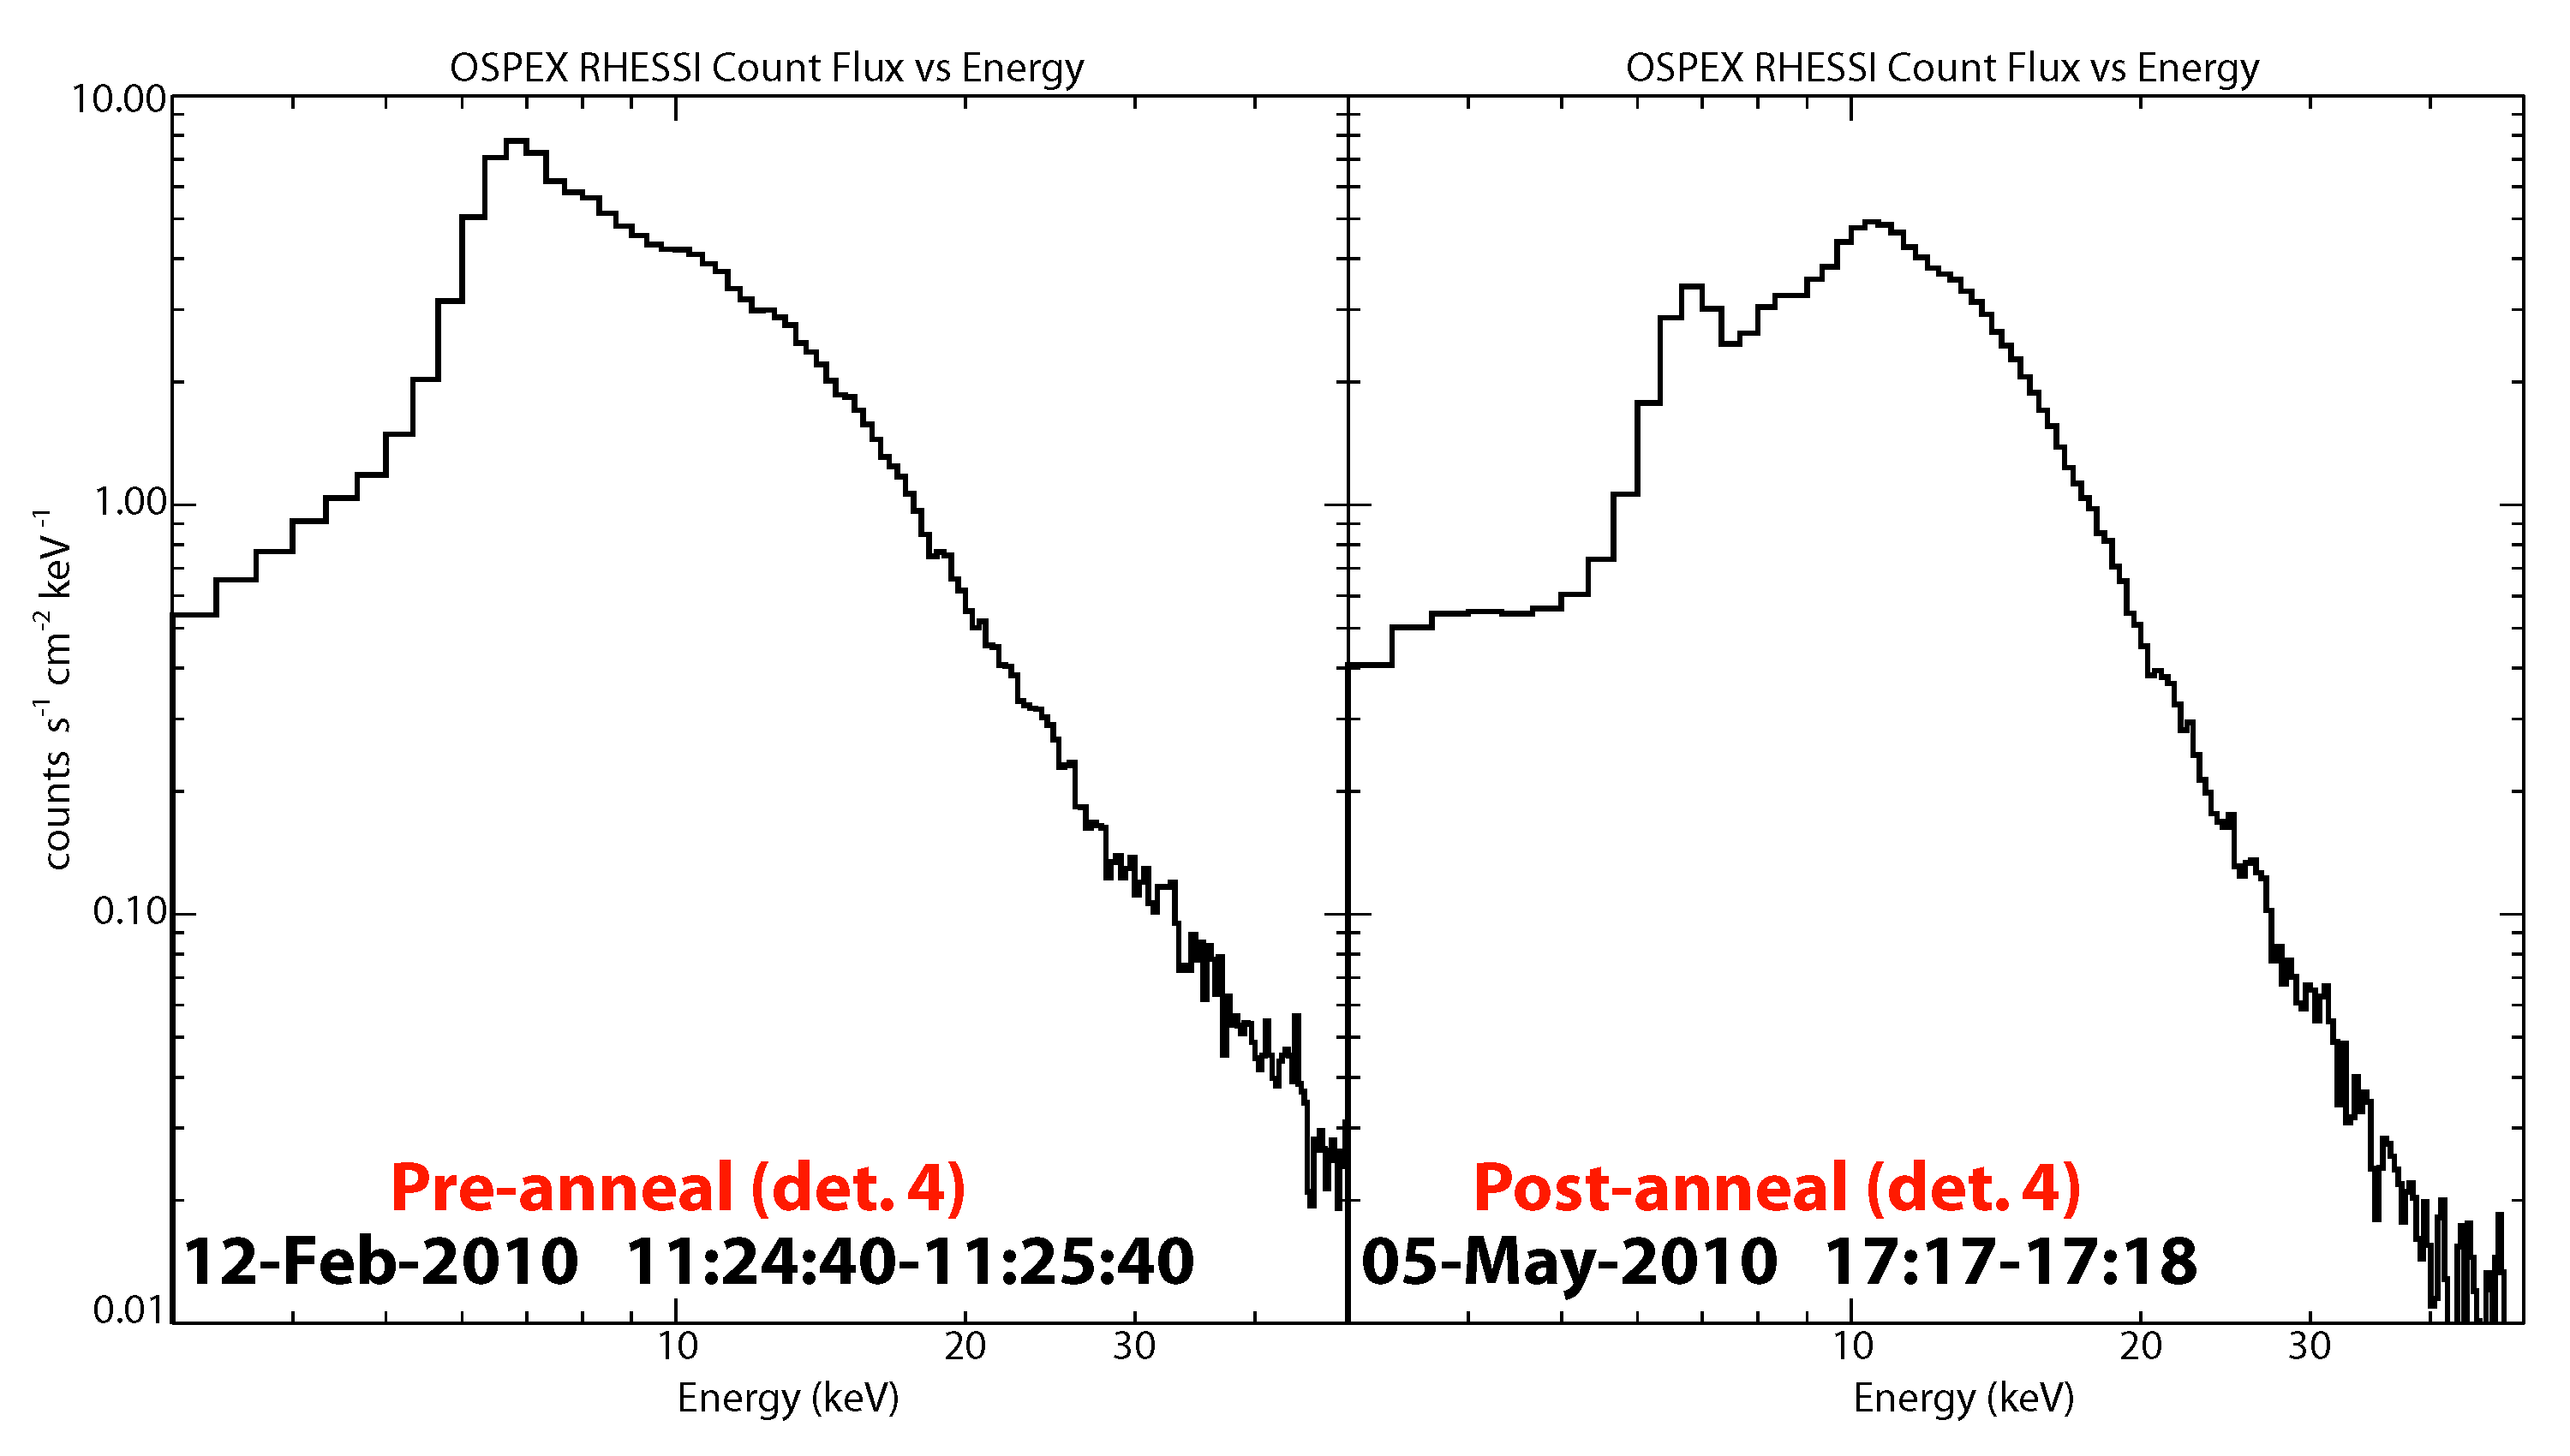
| 12:56, 14 May 2010 | 127fig2b.png (file) | Hhudson | 25 KB | (Spectrum of a small flare (SOL20020508T17:17) obtained after the successful annealing operation (courtesy Richard Schwartz, GSFC).) | 1 |
| 22:29, 18 May 2010 | 127fig3.png (file) | Hhudson | 42 KB | (Comparison of soft X-ray spectra for a flare prior to the anneal and after the anneal, courtesy Amir Caspi. ) | 1 |
| 12:40, 1 June 2010 | 128f1.jpg (file) | Hhudson | 62 KB | (The "megaflare" on YZCMi: <i>left,</i> the light curve; <i>right,</i> a spectrum) | 1 |
| 13:15, 1 June 2010 | 128f2.jpg (file) | Hhudson | 157 KB | (Image of the "seahorse" flare of August 7, 1972, obtained in Hα at the [http://www.bbso.njit.edu/Big Bear Solar Observatory].) | 1 |
| 18:32, 13 June 2010 | 129fig1.jpg (file) | Hhudson | 170 KB | (Maps of the Bastille Day flare, superposed on an array of positive (P) and negative (N) poles used to characterize the solar magnetic field. <it>Left:</it> hard X-rays; <it>right:</it> UV ribbons time-coded according to the bar at the bottom. Note that b) | 2 |
| 19:27, 13 June 2010 | 129fig2.jpg (file) | Hhudson | 74 KB | (Time variations in selected individual UV pixels within the flare ribbons) | 1 |
| 08:18, 22 August 2018 | 12f1.png (file) | Hhudson | 51 KB | 1 | |
| 08:18, 22 August 2018 | 12f2.png (file) | Hhudson | 296 KB | 1 | |
| 08:19, 22 August 2018 | 12f3.png (file) | Hhudson | 127 KB | 1 | |
| 19:28, 23 February 2021 | 12jun10fitd3e1i0_v2.png (file) | Amackinnon | 14 KB | (Fermi LAT data from the 12 June 2010 flare plus best fit FLUKA template.) | 1 |
| 18:21, 23 February 2021 | 12jun2010_GBM_FLUKA.png (file) | Amackinnon | 83 KB | (FLUKA model spectrum fit to the GBM data from the 12 June 2010 flare.) | 1 |
| 15:58, 6 May 2013 | 130427a_lateplot.png (file) | Hhudson | 14 KB | (A late burst, observed only at lower energies) | 1 |
First page |
Previous page |
 Next page |
Last page |