File list
From RHESSI Wiki
This special page shows all uploaded files. By default the last uploaded files are shown at top of the list.
A click on a column header changes the sorting.| Date | Name | User | Description | Versions | |
|---|---|---|---|---|---|
| 02:18, 14 April 2009 | 99_Blank.png (file) | Lsvalgaard | 218 B | 1 | |
| 08:24, 22 August 2018 | 20f2.png (file) | Hhudson | 710 B | 1 | |
| 20:44, 23 July 2014 | Test.jpg (file) | JanGrafvonderPahlen | 727 B | 1 | |
| 08:24, 22 August 2018 | 20f1.png (file) | Hhudson | 2 KB | 1 | |
| 08:25, 22 August 2018 | 20f7.png (file) | Hhudson | 2 KB | 1 | |
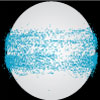
| 11:03, 5 November 2008 | Icon_85.jpg (file) | Hhudson | 2 KB | (Sobel-filtered white-light image constructed from one month's worth of RHESSI aspect-camera data.) | 1 |
| 11:14, 12 November 2008 | Icon_80.jpg (file) | Hhudson | 2 KB | (Gauguin's view of the McClymont Jerk) | 1 |
| 23:42, 11 September 2009 | 39_amplitudes_and_phases.png (file) | Schriste | 4 KB | (Visibility amplitudes and phases derived from the stacked counts in Figure 2d. Roll bins #3,4 & 5 taken from the three selected regions are shown in the same colors as the previous figure.) | 1 |
| 11:09, 15 April 2014 | Icon223.png (file) | Hhudson | 4 KB | 1 | |
| 08:24, 22 August 2018 | 20f3.png (file) | Hhudson | 4 KB | 1 | |
| 09:49, 15 February 2010 | Plot_314MHz.png (file) | Haurass | 4 KB | 1 | |
| 13:21, 5 November 2008 | Icon_81.jpg (file) | Hhudson | 4 KB | (Solar centroid locations of thousands of X-ray microflares observed by RHESSI. ) | 1 |
| 21:48, 2 January 2020 | Eqn3.jpg (file) | Amackinnon | 5 KB | 2 | |
| 13:17, 5 November 2008 | Icon_82.jpg (file) | Hhudson | 5 KB | 1 | |
| 20:38, 15 September 2017 | 306e1.png (file) | Hhudson | 5 KB | 1 | |
| 08:25, 22 August 2018 | 20f8.png (file) | Hhudson | 5 KB | 1 | |
| 03:16, 25 November 2011 | Icon164.png (file) | Hhudson | 5 KB | 2 | |
| 15:15, 23 May 2009 | Icon102.png (file) | Hhudson | 5 KB | 2 | |
| 18:57, 21 December 2011 | Cryo_current_20111215.png (file) | Jmctiernan | 5 KB | (RHESSI cryocooler current for two days, 2011-12-15 and 2011-12-16) | 1 |
| 13:51, 30 September 2013 | Icon208.png (file) | Hhudson | 5 KB | (A cartoon from Kosugi (1985) showing the possibility of gyroresonance contributions to the post-flare loops comprising a microwave thermal source of the PBI/GRF type.) | 1 |
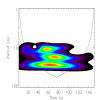
| 23:41, 11 September 2009 | 39_modulated_counts.png (file) | Schriste | 5 KB | (RHESSI modulation profile. The green vertical lines mark the boundaries of spacecraft rotations, (units of 360 degrees) and the red tick marks indicate the roll bins selected for phase-bin stacking. Three sets of rollbins are identified by the colors blue) | 1 |
| 13:14, 5 November 2008 | Icon_83.jpg (file) | Hhudson | 5 KB | 1 | |
| 10:53, 3 January 2020 | Eqn5.jpg (file) | Amackinnon | 5 KB | 1 | |
| 23:40, 11 September 2009 | 39_energy-binned_pulse_hts.png (file) | Schriste | 5 KB | (Energy-binned pulse heights.) | 1 |
| 03:46, 5 January 2010 | Hessi_dets_test_hi_ct1b.png (file) | Jmctiernan | 5 KB | (D1 sensitivity relative to background-subtracted GOES) | 1 |
| 03:36, 6 January 2009 | Icon92.jpg (file) | Schriste | 5 KB | 1 | |
| 00:18, 10 February 2011 | Hsi_flare_list_split_flare_sm.png (file) | Jmctiernan | 5 KB | (Inside hsi_flare_list_fill, demonstration of temp_split_flare on extra-smoothed data) | 1 |
| 23:44, 9 February 2011 | Hsi_flare_list_split_flare.png (file) | Jmctiernan | 5 KB | (Inside hsi_flare_list_fill, demonstration of temp_split_flare results) | 1 |
| 23:42, 11 September 2009 | 39_stacked_counts_3_rbins.png (file) | Schriste | 6 KB | ( Stacked roll bins #3,4 & 5 taken from the three selected regions shown in corresponding colors in the previous figure.) | 1 |
| 23:49, 9 February 2011 | Hsi_flare_list_simple_flare.png (file) | Jmctiernan | 6 KB | (Inside hsi_flare_list_fill, a simple flare finding.) | 1 |
| 13:38, 28 September 2010 | Icon136.jpg (file) | Hhudson | 6 KB | (Courtesy MDI) | 1 |
| 08:13, 11 March 2015 | Sunant_flux_20140610.png (file) | JuhaKallunki | 6 KB | (MRO solar antenna measurement on 20140610) | 1 |
| 01:53, 23 December 2008 | Icon91.png (file) | Schriste | 6 KB | 1 | |
| 09:34, 23 October 2012 | RhessiLightcurve.png (file) | HeatherRatcliffe | 6 KB | (RHESSI Lightcurves for the second Glasgow Callisto event ) | 1 |
| 14:30, 13 July 2011 | Icon155.png (file) | Hhudson | 6 KB | (A hard X-ray spike elicits a sympathetic response) | 1 |
| 23:47, 9 February 2011 | Hsi_flare_list_mult_flare.png (file) | Jmctiernan | 6 KB | (Inside hsi_flare_list_fill, an orbit with lots of flares, which will need splitting.) | 2 |
| 00:29, 22 December 2009 | Hessi_dets_test_ct24.png (file) | Jmctiernan | 6 KB | (Ratio of Rhessi counts for detector 1 to GOES Hi channel flux, for twos samples of flares.) | 1 |
| 10:42, 22 January 2009 | Icon93.jpg (file) | Hhudson | 6 KB | 1 | |
| 10:37, 20 March 2014 | Icon221.png (file) | Hhudson | 6 KB | 1 | |
| 23:12, 13 March 2009 | 97_jmm_Ppr2008_f4.png (file) | Jmctiernan | 6 KB | (RHESSI versus GOES T, for the first 7 months of the mission.) | 1 |
| 14:30, 5 November 2019 | Icon363.png (file) | Hhudson | 6 KB | 1 | |
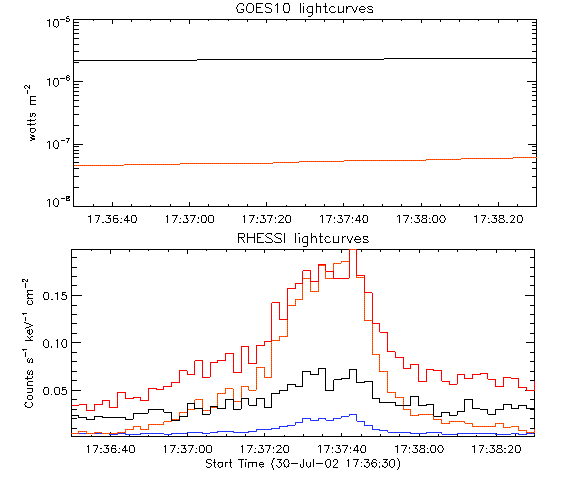
| 21:01, 7 June 2011 | 153f1.png (file) | Hhudson | 6 KB | (Upper, GOES soft X-rays, and lower, RHESSI hard X-rays. Note that there is no soft X-ray counterpart of the burst.) | 1 |
| 10:03, 3 September 2015 | 260f2.png (file) | Hhudson | 6 KB | 1 | |
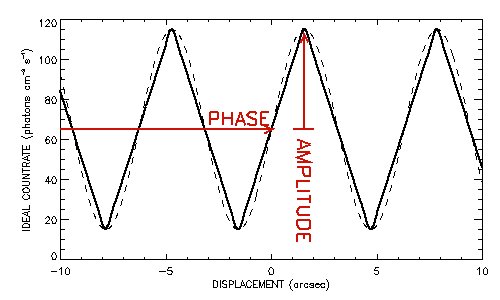
| 23:39, 11 September 2009 | 39_triangle_waveform.png (file) | Schriste | 6 KB | (Ideal hard X-ray grid response (solid curve), with its associated fundamental sinusoid (dashed curve).) | 1 |
| 00:25, 22 December 2009 | Hessi_dets_test_ct14.png (file) | Jmctiernan | 6 KB | (Ratio of RHESSI Detector 1 counts versus both GOES channels versus time) | 1 |
| 19:08, 6 September 2019 | Ppr2019_nugget_20110213_chi2.png (file) | Jmctiernan | 6 KB | (Chi^2 versus cutoff energy E_c, coronal (black), photospheric (red) abundance) | 1 |
| 15:22, 28 September 2009 | 111Icon.jpg (file) | Hhudson | 6 KB | (A five-hour RHESSI integration at 4-8 keV starting some 9 hours after a C-class flare and CME eruption.) | 1 |
| 15:26, 28 September 2009 | Icon111.jpg (file) | Hhudson | 6 KB | (With an extremely deep integration, RHESSI may have detected X-rays from the base of a post-CME current sheet.) | 1 |
| 03:05, 5 January 2010 | Hessi_dets_test_ct1b.png (file) | Jmctiernan | 7 KB | (Time averaged RHESSI - background subtracted GOES data.) | 1 |
| 03:03, 5 January 2010 | Hessi_dets_test_ctb.png (file) | Jmctiernan | 7 KB | (Relative sensitivity for sample with ok background-subtracted GOES Hi data.) | 1 |
First page |
Previous page |
Next page |
Last page |