User talk:Jiongqiu
From RHESSI Wiki
| Nugget | |
|---|---|
| Number: | 129 |
| 1st Author: | Jiong Qiu |
| 2nd Author: | |
| Published: | 2013 January |
| Next Nugget: | Albedo and the modification of RHESSI results |
| Previous Nugget: | Awesome Stellar Flare Spectra |
| List all | |
Contents |
Introduction
Solar flare emissions on very short time scales, from a few seconds to several tens of milli-seconds, have been in found in hard X-ray and microwave observations a few decades before RHESSI. These are called elementary bursts, their time and spatial scales maybe indicative of fundamental scales of flare energy release. For example, the bursts' time scales may depend on the characteristic size of the elementary flux tubes (e.g., Sturrock et al. , 1984; LaRosa & Moore , 1993), or the turbulent dynamics of the reconnecting current sheets (eg., Litvinenko , 1996). Specifically, spikes of very short timescales reported in hard X-ray and microwave observations will provide diagnostics of acceleration of non- thermal particles in flare environment. A few studies correlating high cadence yet spatially unresolved hard X-ray observations with high cadence high resolution optical observations have shown that the hard X-ray bursts are correlated with optical emission on time scales of below one second, suggesting that these elementary bursts are thick-target emissions.
The Reuven Ramaty High Energy Solar Spectroscopic Imager (RHESSI Lin et al. , 2002) launched in early 2002 has unprecedented resolution to investigate the temporal, spectral and spatial properties of hard X-ray spikes. This nugget studies
Revisiting the Bastille Day Flare
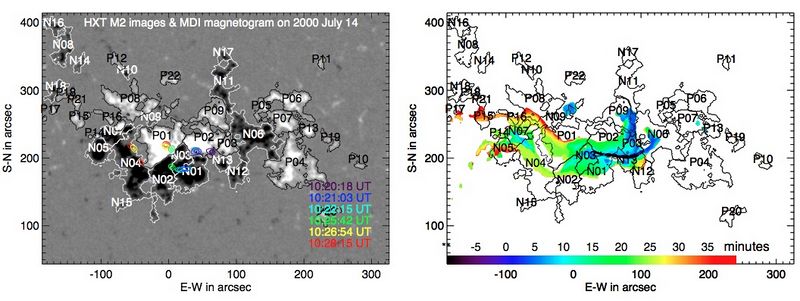
To explore the relationship between hard X-ray and UV emissions at the feet of flare loops, we revisit one of the best known two-ribbon flares, the Bastille day flare, which occurred at 10 UT on 2000 July 14, and was observed by Yohkoh and TRACE among others. Figure 1 gives snapshots of the flare evolution that these satellites measured in hard X-ray (left) and UV (right) wavelengths, superimposed on an array of magnetic poles. This is a simple way to model the complicated solar magnetic field; some of these model magnetic poles coincide with the sunspots, and others represent various other parts of the photosphere with weaker fields. The color code shows the time evolution of flare's UV brightening, which spreads both along the magnetic polarity inversion line (PIL) in a nearly organized manner from the west to the east and perpendicular to and away from the PIL as would be expected in the 2D reconnection model. The >20 keV hard X-ray emission of the flare shows only 2 or 3 compact sources. During the flare evolution, the hard X-ray sources gradually shift along the PIL, similar to the evolution pattern of UV brightening.

Discovery of UV "cooling"
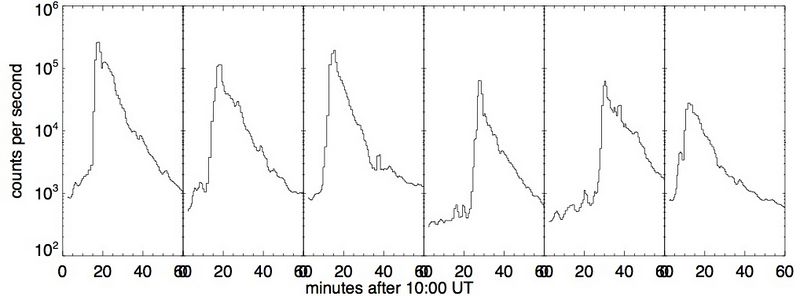
Generally, and in this case as well, the hard X-ray and UV emissions have strikingly similar time variations when viewed as a whole, but in detail they may not agree. The UV emission persists at low levels, filling out the ribbon structures even when the hard X-ray footpoints have disappeared or moved elsewhere. We have studied the time variation in individual pixels of the TRACE images and find a very suggestive pattern, which we illustrate in Figure 2.
The individual pixels show a characteristic pattern. At the beginning, there is an impulsive increase; following this, each pixel appears to decay exponentially in brightness. We suggest that the UV emission, which rises nearly instantaneously with the hard X-rays, is likely produced primarily by non-thermal electron precipitation, and then undergoes an elongated decay well after the decay of hard X-rays. This could be identified with the cooling (or loss of excess energy in the form of gas pressure) of magnetic loops formed as a part of the flare arcade. The tendency for individual loops to have similar decay times would then correspond to the fact that the loops have similar dimensions.
Conclusions
The revisit raises some interesting questions. First, obviously, the evolution and mapping of UV and hard X-ray sources reflect the pattern of magnetic reconnection which is not entirely 2-dimensional, and second, the coincident rise and peak but delayed decay in UV emission with respect to hard X-ray emission suggests some different physics, not directly related to hard X-ray producing process, taking place during the gradual decay of UV emission.
We think that an individual point in the ribbon stays bright, even after its initial excitation (identified with the hard X-ray footpoint) has faded away. The persistence of this UV brightness allows the ribbons to have a larger extent than the footpoints, and to follow a different pattern of evolution.
Acknowledgements
This Nugget is based on a presentation at the recent Solar Physics Division meeting by the author with Wenjuan Liu, Nicholas Hill, and Maria Kazachenko.
[Category: Nugget]]
