Weekly Report 17Sep2010
From RHESSI Wiki
| Line 1: | Line 1: | ||
===Imaging the Albedo with Pixon=== | ===Imaging the Albedo with Pixon=== | ||
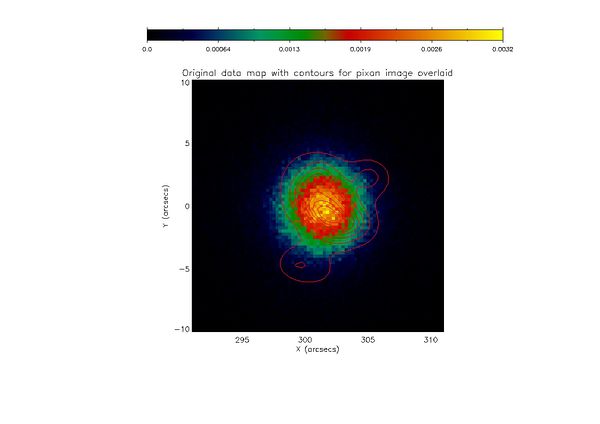
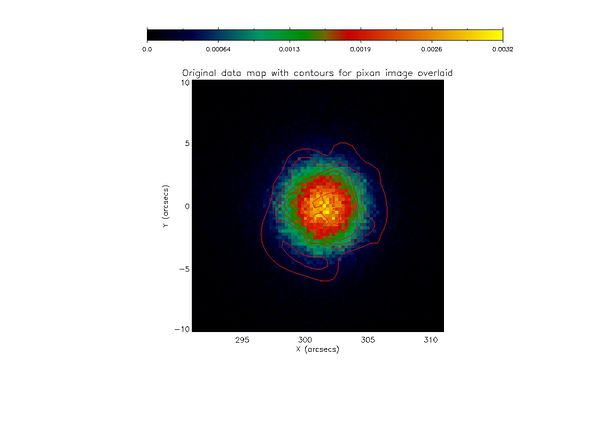
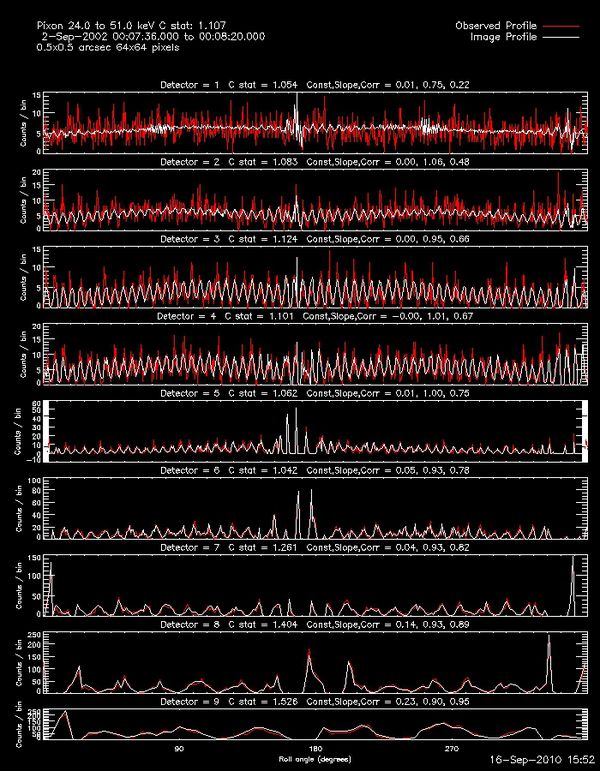
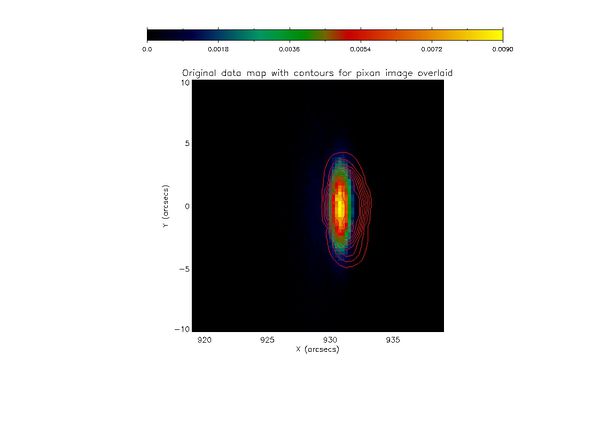
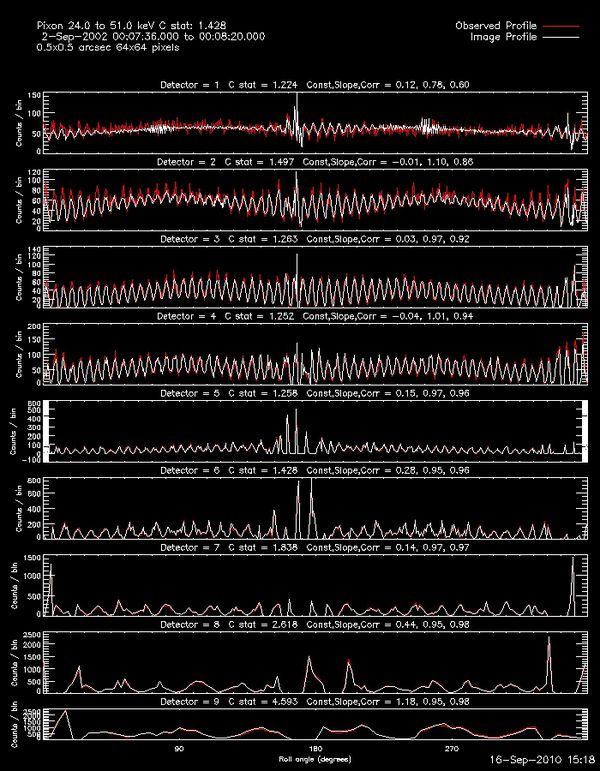
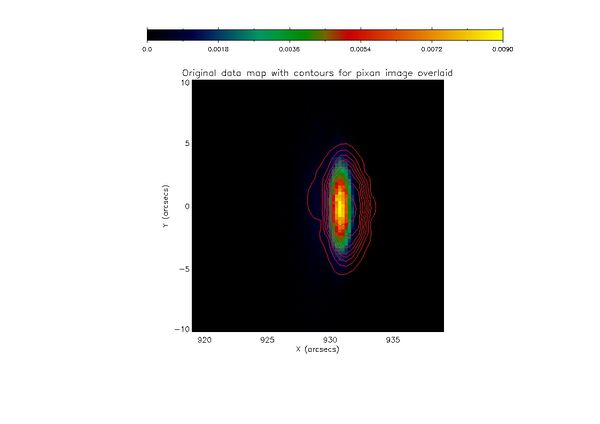
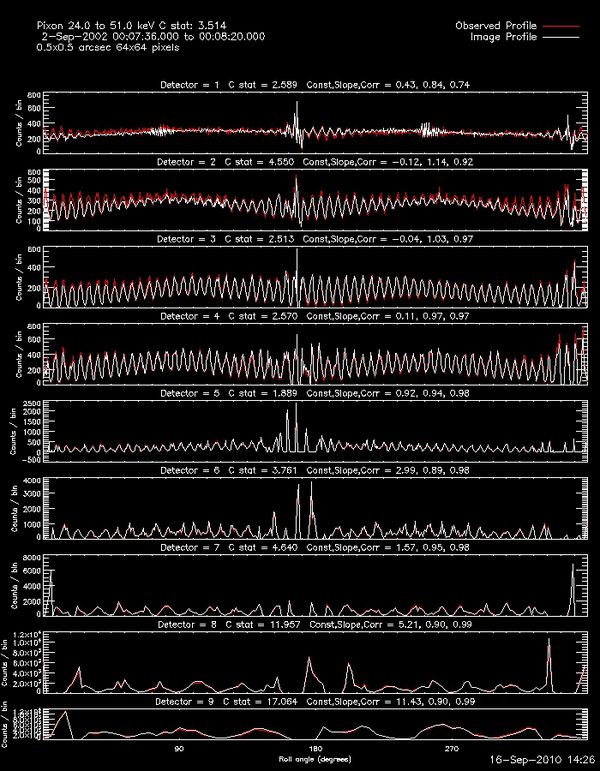
| - | + | The following show Pixon images for simulated data of a point source with albedo. Each image shows the contours for the Pixon reconstruction overlaid on the a map of the original data. Below each image are the profiles for the data and the fit showing the C statistic for each detector. For each image the following parameters were used: | |
| + | Time: 2-September-2002 00:07:36 - 00:08:20 | ||
| + | Detectors: All Detectors | ||
| + | Image Size: 64 X 64 | ||
| + | Pixel Size: .5 X .5 | ||
| - | + | Above each image is the total counts in the final image. Below each image is the source size data as calculated using the 3 sigma source size program written by Rick Pernak. | |
| - | |||
| + | ====Reconstructed Pixon Images for a point source with albedo located at heliocentric X = 301 arcsec and Y = 0.0==== | ||
| + | The total counts in the final image below is: ~10e4 counts | ||
| - | [[Image: | + | [[Image:Org data 301 10e4 cont.jpg|center|thumb|600px|The original data map with the contours of the Pixon Image overlaid for an eventlist with total counts ~10e4]] |
| - | + | The 3 sigma parameters for the reconstructed image assuming an elliptical source are: | |
| + | Source Flux: 32.0174 | ||
| + | Source X: 301.042 | ||
| + | Source Y: -0.0517814 | ||
| + | Source FWHM: 4.71759 | ||
| + | Eccentricity: 0.253152 | ||
| + | Source Angle: 90.0000 | ||
| - | |||
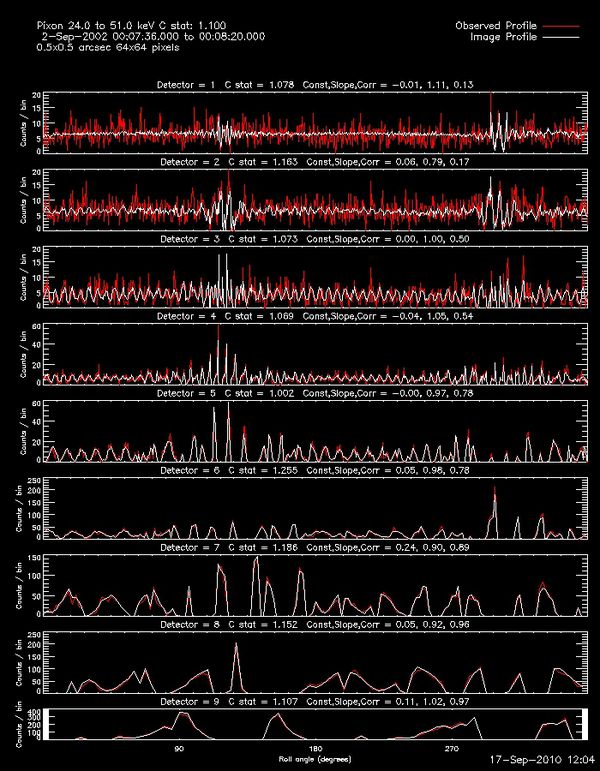
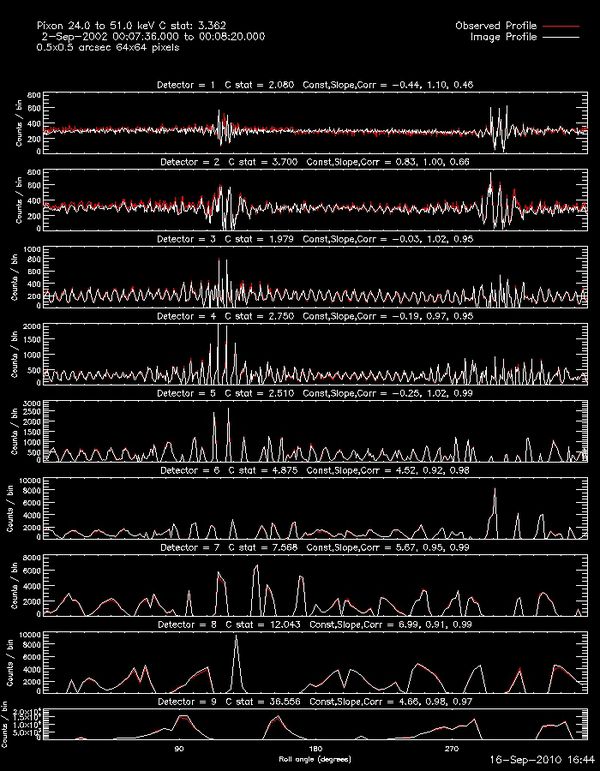
| - | [[Image: | + | The following plot shows the profile for each detector compared with the fitted profile along with the C statistic for each detector. |
| + | [[Image:Pixon cstat profile sim 301 10e4.jpg |center|thumb|600px|The profile for each detector along with the fitted profile from Pixon. The C statistic for each detector is also shown.]] | ||
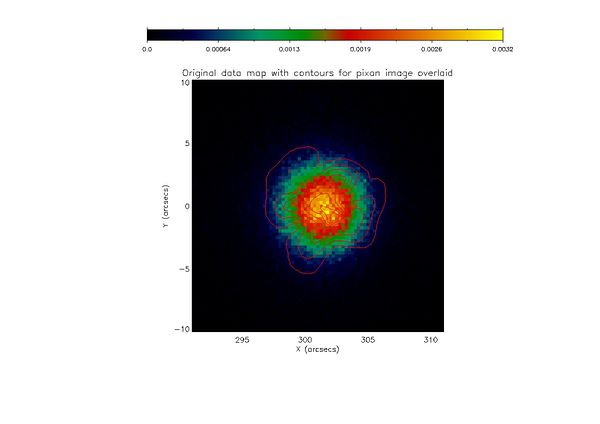
| + | The total counts in the final image below is: ~10e5 counts | ||
| + | [[Image:Org data 301 10e5 cont.jpg |center|thumb|600px|The original data map with the contours of the Pixon Image overlaid for an eventlist with total counts ~10e5]] | ||
| + | The 3 sigma parameters for the reconstructed image assuming an elliptical source are: | ||
| + | Source Flux: 310.592 | ||
| + | Source X: 301.157 | ||
| + | Source Y: -0.344853 | ||
| + | Source FWHM: 3.94633 | ||
| + | Eccentricity: 0.0599250 | ||
| + | Source Angle: 107.000 | ||
| + | |||
| + | |||
| + | The following plot shows the profile for each detector compared with the fitted profile along with the C statistic for each detector. | ||
| + | [[Image:Pixon cstat profile sim 301 1x10e5.jpg |center|thumb|600px|The profile for each detector along with the fitted profile from Pixon. The C statistic for each detector is also shown.]] | ||
| + | |||
| + | The total counts in the final image below is: ~10e6 | ||
| + | [[Image:Org data 301 10e6 cont.jpg |center|thumb|600px|The original data map with the contours of the Pixon Image overlaid for an eventlist with total counts ~10e6]] | ||
| + | The 3 sigma parameters for the reconstructed image assuming an elliptical source are: | ||
| + | Source Flux: 1473.15 | ||
| + | Source X: 301.232 | ||
| + | Source Y: -0.429101 | ||
| + | Source FWHM: 4.42663 | ||
| + | Eccentricity: 0.260343 | ||
| + | Source Angle: 167.000 | ||
| + | |||
| + | |||
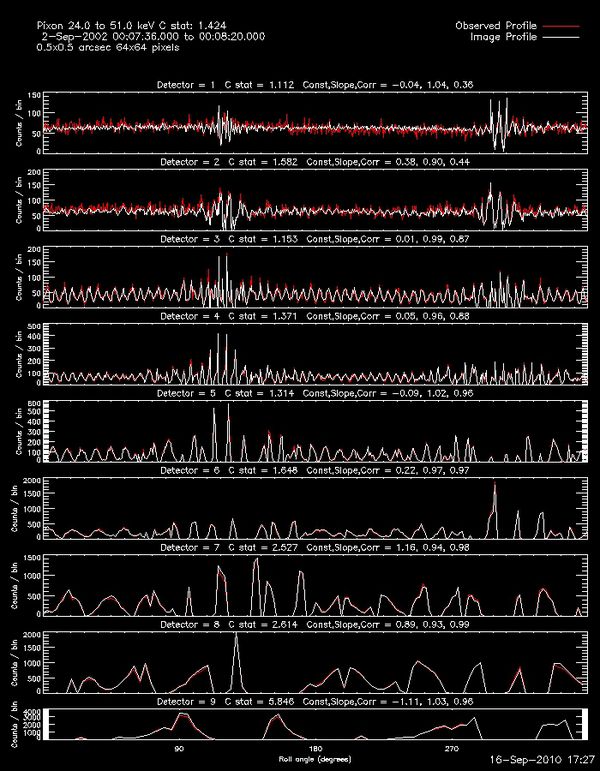
| + | The following plot shows the profile for each detector compared with the fitted profile along with the C statistic for each detector. | ||
| + | [[Image:Pixon cstat profile sim 301 10e5.jpg|center|thumb|600px|The profile for each detector along with the fitted profile from Pixon. The C statistic for each detector is also shown.]] | ||
| + | |||
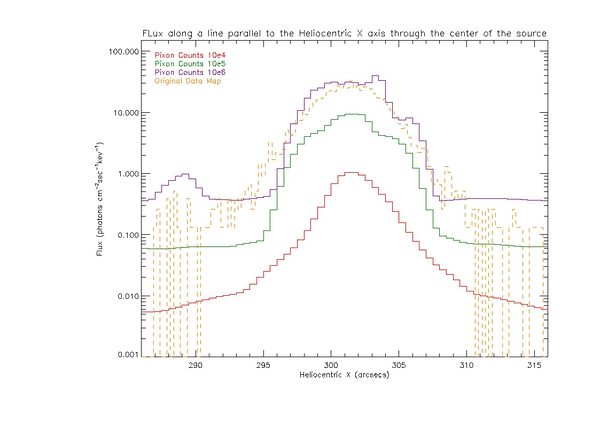
| + | [[Image:Profiles 301.jpg |center|thumb|600px|]] | ||
| + | |||
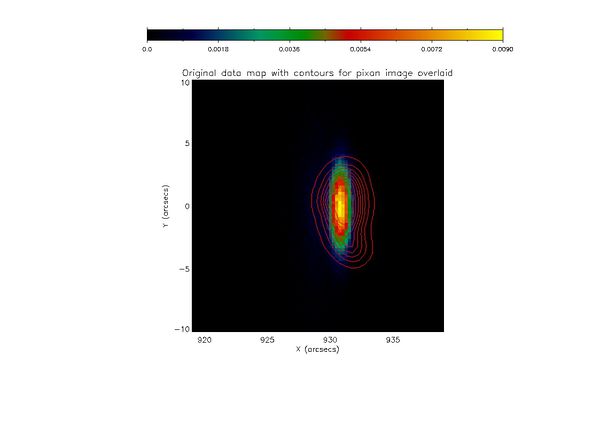
| + | ====Reconstructed Pixon Images for a point source with albedo located at heliocentric X = 929 arcsec and Y = 0.0==== | ||
[[Image:Org data 930 10e4 cont.jpg |center|thumb|600px|]] | [[Image:Org data 930 10e4 cont.jpg |center|thumb|600px|]] | ||
Revision as of 16:48, 19 September 2010
Imaging the Albedo with Pixon
The following show Pixon images for simulated data of a point source with albedo. Each image shows the contours for the Pixon reconstruction overlaid on the a map of the original data. Below each image are the profiles for the data and the fit showing the C statistic for each detector. For each image the following parameters were used: Time: 2-September-2002 00:07:36 - 00:08:20 Detectors: All Detectors Image Size: 64 X 64 Pixel Size: .5 X .5
Above each image is the total counts in the final image. Below each image is the source size data as calculated using the 3 sigma source size program written by Rick Pernak.
Reconstructed Pixon Images for a point source with albedo located at heliocentric X = 301 arcsec and Y = 0.0
The total counts in the final image below is: ~10e4 counts
The 3 sigma parameters for the reconstructed image assuming an elliptical source are:
 Source Flux:  32.0174
 Source X:     301.042
 Source Y:     -0.0517814
 Source FWHM:  4.71759
 Eccentricity: 0.253152
 Source Angle: 90.0000
The following plot shows the profile for each detector compared with the fitted profile along with the C statistic for each detector.
The total counts in the final image below is: ~10e5 counts
The 3 sigma parameters for the reconstructed image assuming an elliptical source are:
 Source Flux:   310.592
 Source X:      301.157
 Source Y:      -0.344853
 Source FWHM:   3.94633
 Eccentricity:  0.0599250
 Source Angle:  107.000
The following plot shows the profile for each detector compared with the fitted profile along with the C statistic for each detector.
The total counts in the final image below is: ~10e6
The 3 sigma parameters for the reconstructed image assuming an elliptical source are:
Source Flux:  1473.15
Source X:     301.232
Source Y:     -0.429101
Source FWHM:  4.42663
Eccentricity: 0.260343
Source Angle: 167.000
The following plot shows the profile for each detector compared with the fitted profile along with the C statistic for each detector.
