Weekly Report 24Sep2010
From RHESSI Wiki
| Line 78: | Line 78: | ||
The C statistics with the correction factors are much smaller than the C statistics without these factors, as shown in the last report. Looking at the profiles it seems that the difference should not be so large. | The C statistics with the correction factors are much smaller than the C statistics without these factors, as shown in the last report. Looking at the profiles it seems that the difference should not be so large. | ||
| - | The values of the C statistic and profiles for the fit with Pixon and the sensitivity correction for the detectors are below. | + | The values of the C statistic and profiles for the fit with Pixon and the sensitivity correction for the detectors are below. These are the profiles the Pixon algorithm generates on the fly as it is creating the image. |
| - | [[Image:Pixon prof rmc corr.jpg|center|thumb|600px]] | + | [[Image:Pixon prof rmc corr.jpg|center|thumb|600px|The final profile fits generated by the Pixon algorithm on the fly while creating the image.]] |
| + | |||
| + | The obvious takeaway from these plots is the value of the C statistic is different than the C statistics from the object. I've tried to track this down but it looks to me that these values should be coming from the same place. I'm continuing to try and figure out where the difference is coming about. | ||
===Adding Content to the new RHESSI Website=== | ===Adding Content to the new RHESSI Website=== | ||
Revision as of 14:20, 27 September 2010
Pixon Images with Detector Sensitivity Corrections from Visibility Forward Fit
The following was done by creating an image of the 5 arcsec source near the limb with an albedo contribution using the visibility forward fit algorithm. A single elliptical source was used as the model. The corrections to the detector sensitivities generated by visibility forward fit were then used with the Pixon algorithm to create a Pixon image from the same eventlist.
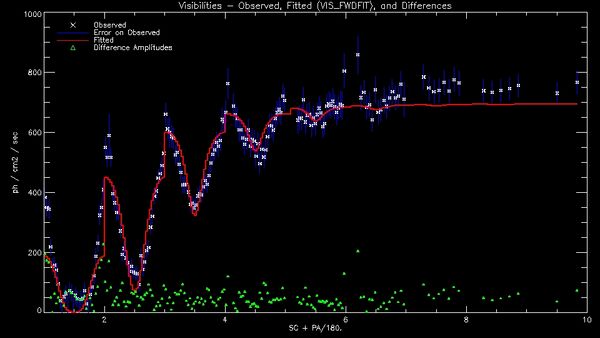
The following plot shows a fit to the visibilities generated by visibility forward fit for an elliptical source.
The fit to the visibilities shown above was used to create the reconstructed image. The C statistics for the reconstructed image are shown in the table below, along with the total C statistic just below the table.
| Detector | D1 | D2 | D3 | D4 | D5 | D6 | D7 | D8 | D9 | |
|---|---|---|---|---|---|---|---|---|---|---|
| C Statistic | 130.071 | 125.136 | 78.9797 | 119.233 | 98.152 | 196.335 | 334.414 | 634.593 | 1328.47 |
Total C Statistic : 163.983
From the table above we can see that when constructing the image using visibility forward fit, the best image has very large C statistics. This may be due to the fact that only a single elliptical source was used to create the image. The original data also contains an extended albedo source which was not imaged by visibility forward fit. I am testing this by trying to create an image with two sources, one for the compact elliptical source and one for the extended source. So far using the combination of sources has not yielded a good fit because the parameters in the fit to the extended source are reaching their allowed limits causing no actual image to be made. I'm going to try to fix this using my knowledge of the original data set to create an image using zero iterations but good starting parameters to see if I can get an estimate of the C statistic.
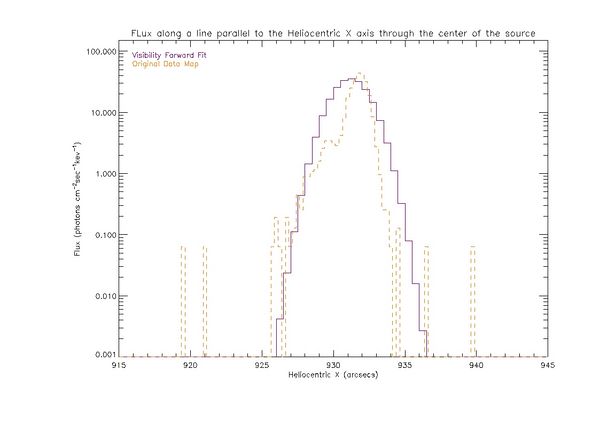
The plot below shows the profile in the Heliocentric X direction of the visibility forward fit image and the original data map. the original data map has been scaled so the peak matches the peak of the visibility forward fit image.
The profiles above show the cause of the large C statistic with visibility forward fit. The algorithm uses a single elliptical gaussian as a model. It is only capable of fitting a symmetric elliptical gaussian to the data. In this case the actual data is not symmetric, because of the foreshortening effect it has a shoulder toward disk center. The fit is just symmetric around the peak so it misses the falloff of the original source in both directions,due to their asymmetry. This causes the large C statistics as the original data and the fit are extremely different away from the peak.
The correction factors for the detector sensitivities are shown in the table below. The sensitivities were taken from the visibility forward fit image and used in the Pixon image.
| Detector | D1 | D2 | D3 | D4 | D5 | D6 | D7 | D8 | D9 | |
|---|---|---|---|---|---|---|---|---|---|---|
| Correction Factor | 0.988318 | 0.923258 | 0.981121 | 1.02173 | 0.992234 | 1.02596 | 1.01303 | 1.03640 | 1.02823 |
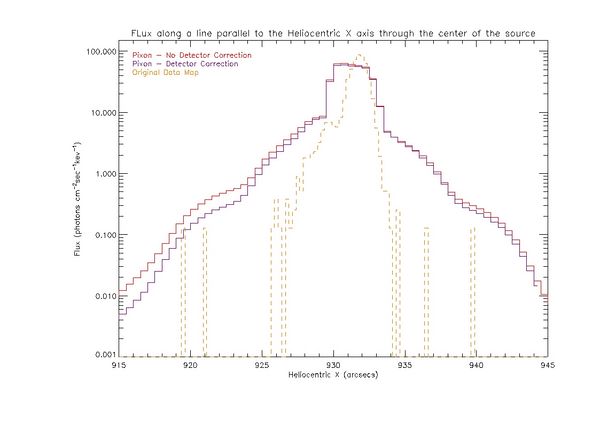
The plot below shows the profile of the Pixon image using the detector sensitivity corrections from visibility forward fit along with the profile for the Pixon image with no correction. The profile of the original data is included as well.
The profile with the sensitivity correction falls off slightly more rapidly than the profile without any correction. They both fall off much less rapidly than the original data map does. The C statistics for the fit with the modified detector sensitivities are below.
| Detector | D1 | D2 | D3 | D4 | D5 | D6 | D7 | D8 | D9 | |
|---|---|---|---|---|---|---|---|---|---|---|
| C Statistic | 1.124 | 1.134 | 1.113 | 1.113 | 1.120 | 1.245 | 1.221 | 1.62321 | 2.10371 |
Total C Statistic: 1.13950
The C statistics with the correction factors are much smaller than the C statistics without these factors, as shown in the last report. Looking at the profiles it seems that the difference should not be so large.
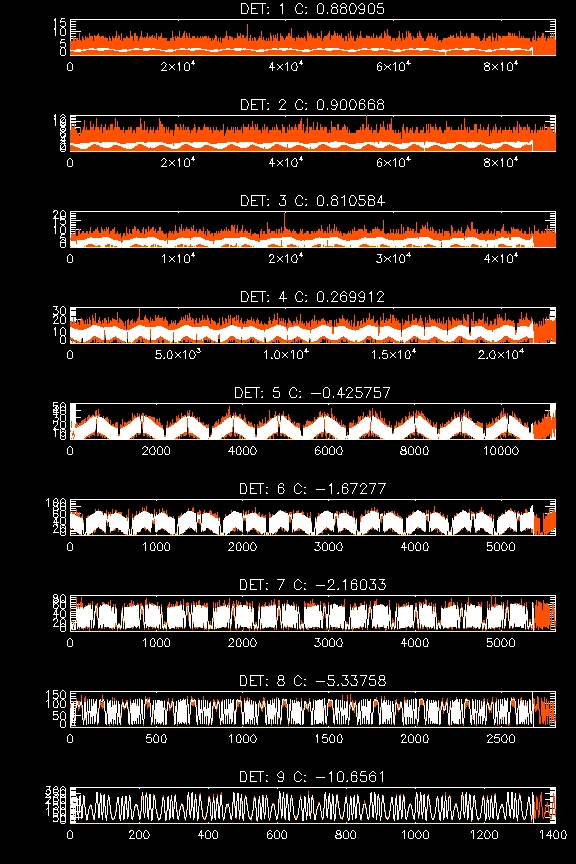
The values of the C statistic and profiles for the fit with Pixon and the sensitivity correction for the detectors are below. These are the profiles the Pixon algorithm generates on the fly as it is creating the image.
The obvious takeaway from these plots is the value of the C statistic is different than the C statistics from the object. I've tried to track this down but it looks to me that these values should be coming from the same place. I'm continuing to try and figure out where the difference is coming about.


