Data from Antarctic AGOs: | |||||||||
Yearly summaries: | |||||||||
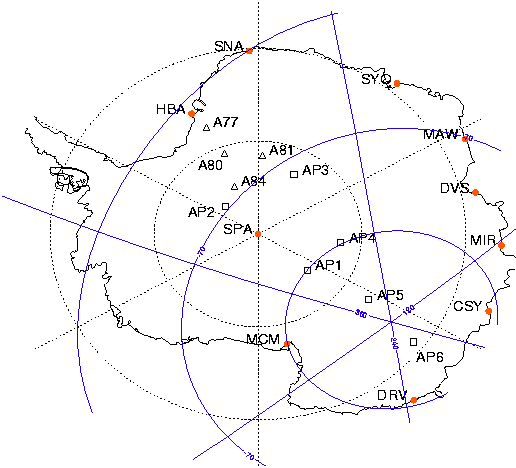
Geographic orientation of AGO stations | |||||||||
Raw All-Sky images from AGO P3 with 427.8nm imaged to the right and 630.0nm to the left. A pixels along the magnetic meridian have been extracted to create one row of the Keogram seen below. | |||||||||
The extracted pixels from raw images have been plotted over a full day of imaging from AGO P1 and South Pole station, creating latitude vs. time plots. Geomagnetic noon occurs around 1530 UT, consistent with the poleward contraction of the cusp. | |||||||||
NOTE: Some of the keograms may appear as over-exposed because the 16-bit data are shown with a limited dynamic range in order to emphasize dim structures.
The above keogram data are sorted according to the month and each plot shows all available stations for that day. For scientific use, especially for a zoom into a shorter time period, trasformation to geographic or geomagnetic coordinates and absolute values please contact the all-sky camera PI.
Support for this effort was provided by NSF under grants ANT-0636899, ANT-0636978, and ANT-0840398.
Data and website mantainance: Yen-Jung Joanne Wu or Stephen B. Mende or Harald U. Frey |
|||||||||