File:107-shs shh.jpg
From RHESSI Wiki
Size of this preview: 610 × 600 pixels
Full resolution (904 × 889 pixels, file size: 139 KB, MIME type: image/jpeg)
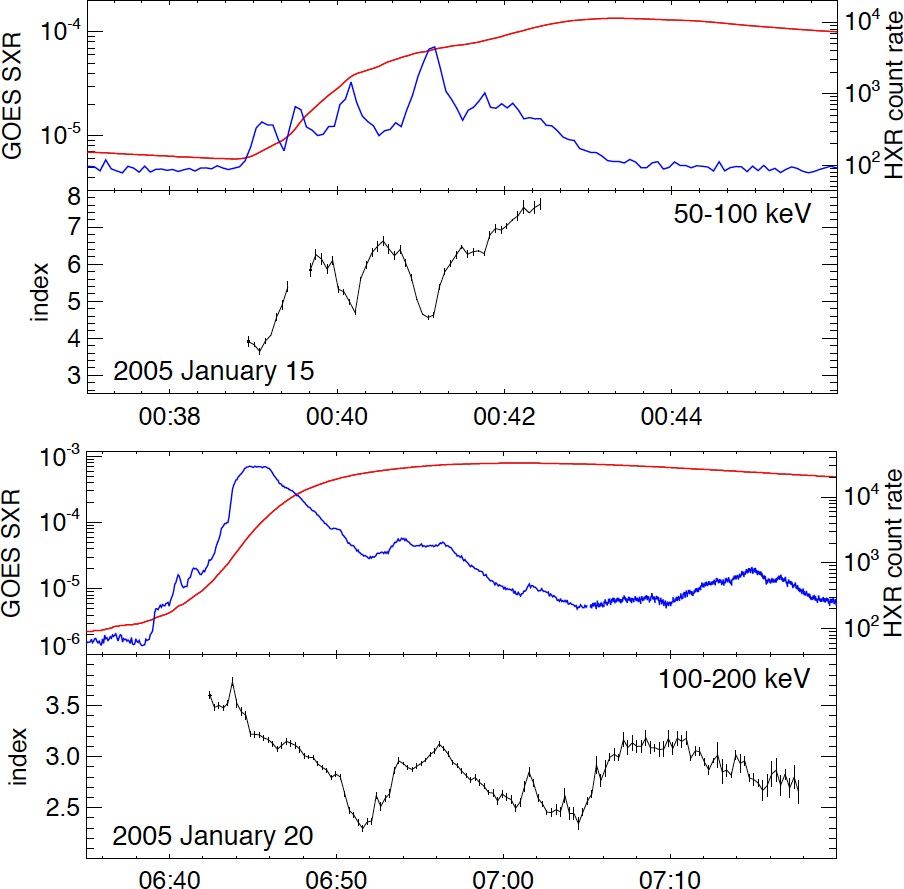
Two flares seen in hard X-rays: Upper, the CMEless event of Jan. 15, 2005; lower, the CME event of Jan. 20. Each two-panel plot shows the GOES soft X-ray flux (red) and the RHESSI hard X-ray flux, as indicated, plus the slope of the hard X-ray spectrum. Note the nice anticorrelation of spectral index and hard X-ray flux (this is the SHS) in the CMEless event, and contrast the gradual hardening (decrease of spectral index) in the CME event.
File history
Click on a date/time to view the file as it appeared at that time.
| Date/Time | Thumbnail | Dimensions | User | Comment | |
|---|---|---|---|---|---|
| current | 01:25, 12 August 2009 | | 904×889 (139 KB) | Hhudson (Talk | contribs) | (Two flares seen in hard X-rays: Upper, the CMEless event of Jan. 15, 2005; lower, the CME event of Jan. 20. Each two-panel plot shows the GOES soft X-ray flux (red) and the RHESSI hard X-ray flux, as indicated, plus the slope of the hard X-ray spectrum. N) |
- Edit this file using an external application (See the setup instructions for more information)
File links
The following page links to this file: