File:204f0.png
From RHESSI Wiki
No higher resolution available.
204f0.png (679 × 210 pixels, file size: 212 KB, MIME type: image/png)
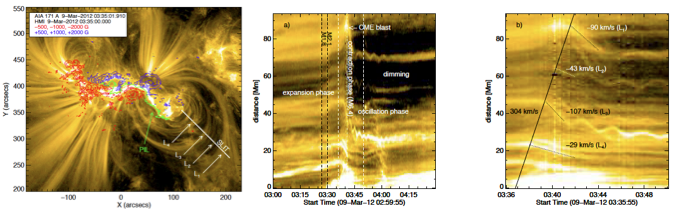
Left - an EUV image of the flare, essentially from above, showing the photospheric magnetic field as colored contours (two polarities), plus the line of a slit used to make plots of position vs. time. These are in the middle and right plots on different time scales. The CME-related dimming is very obvious, as are the contracting and oscillating loops. The diagonal line shows a rough guess at the propagation sequence of excitation of the oscillations. Note the different periods for the different loops.
File history
Click on a date/time to view the file as it appeared at that time.
| Date/Time | Thumbnail | Dimensions | User | Comment | |
|---|---|---|---|---|---|
| current | 15:09, 29 July 2013 | 679×210 (212 KB) | Hhudson (Talk | contribs) | (Left - an EUV image of the flare, essentially from above, showing the photospheric magnetic field as colored contours (two polarities), plus the line of a slit used to make plots of position vs. time. These are in the middle and right plots on different t) |
- Edit this file using an external application (See the setup instructions for more information)
File links
The following page links to this file: