File:99 Overlapping-Cycles.png
From RHESSI Wiki

Size of this preview: 340 × 599 pixels
Full resolution (580 × 1,021 pixels, file size: 42 KB, MIME type: image/png)
Figure 3. Four panels showing the decomposition of sunspot groups by cycle membership. This is unambiguously determined from their magnetic polarities. The bottom three panels show recent minimum periods; our current minimum (the very bottom) shows that the late arrival of new-cycle spots has allowed the number of old-cycle spots, and hence the total spot coverage, to be remarkably low.
File history
Click on a date/time to view the file as it appeared at that time.
| Date/Time | Thumbnail | Dimensions | User | Comment | |
|---|---|---|---|---|---|
| current | 19:13, 27 April 2010 | | 580×1,021 (42 KB) | Hhudson (Talk | contribs) | (Figure 3: Recent solar minima decomposed using the 'region days' analysis into their old-cycle and new-cycle components. Note that the earlier minima had much more overlap between cycles, and hence more activity during their shorter intervals.) |
| 15:02, 12 April 2009 | 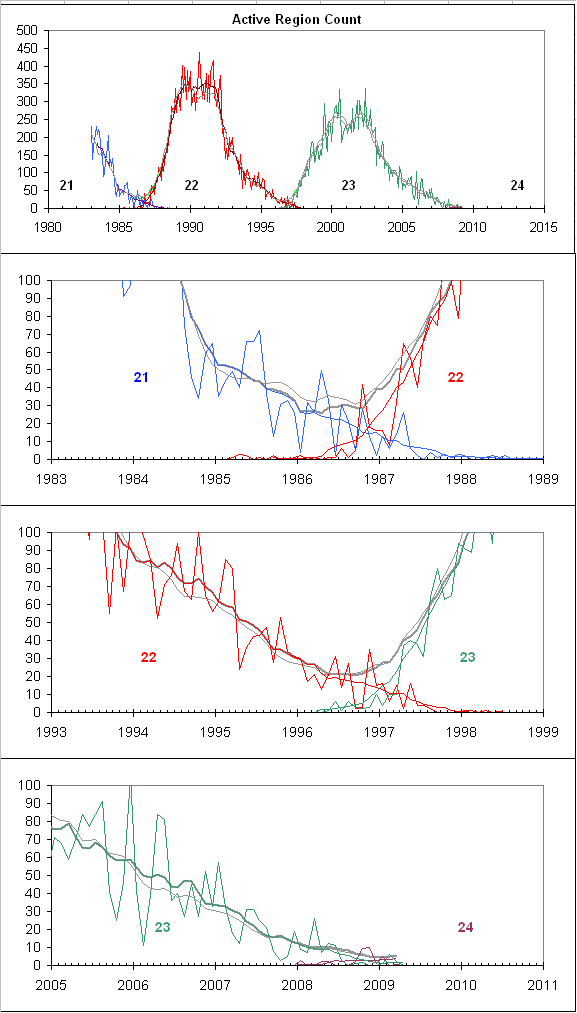 | 577×1,013 (38 KB) | Hhudson (Talk | contribs) | (Figure 3. Four panels showing the decomposition of sunspot groups by cycle membership. This is unambiguously determined from their magnetic polarities. The bottom three panels show recent minimum periods; our current minimum (the very bottom) shows that ) |
- Edit this file using an external application (See the setup instructions for more information)
File links
The following 2 pages link to this file: