File:Electron Spectrum for 01Apr2004.png
From RHESSI Wiki

Size of this preview: 800 × 554 pixels
Full resolution (1,300 × 900 pixels, file size: 50 KB, MIME type: image/png)
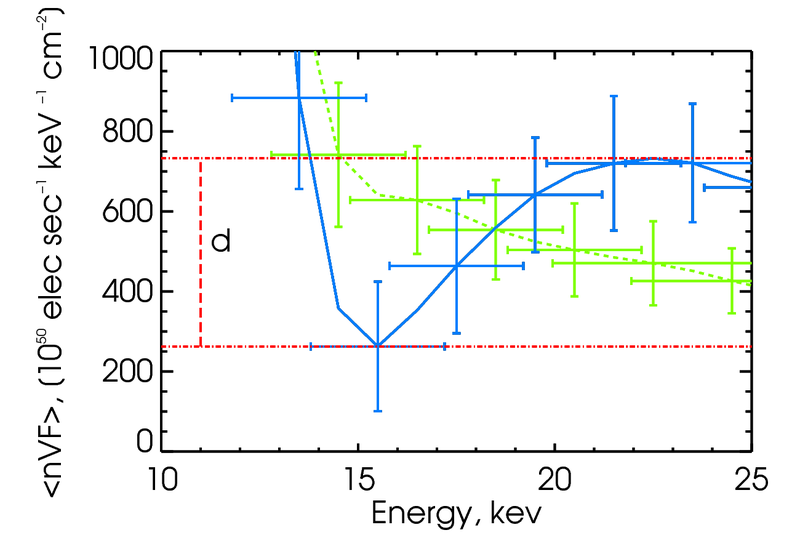
Plot of electron distribution spectrum for the 1 April 2004 23:00 UTC solar flare. The blue line denotes the uncorrected electron spectrum and the green line denotes the electron spectrum after correction for albedo. Both lines are plotted with 1σ error bars. The dip depth, d, is shown as the difference between the minimum and the following maximum.
File history
Click on a date/time to view the file as it appeared at that time.
| Date/Time | Thumbnail | Dimensions | User | Comment | |
|---|---|---|---|---|---|
| current | 15:45, 13 November 2008 |  | 1,300×900 (50 KB) | Schriste (Talk | contribs) | (Plot of electron distribution spectrum for the 1 April 2004 23:00 UTC solar flare. The blue line denotes the uncorrected electron spectrum and the green line denotes the electron spectrum after correction for albedo. Both lines are plotted with 1σ error ) |
- Edit this file using an external application (See the setup instructions for more information)
File links
The following page links to this file: