Imaging Quasi-Periodic Oscillations in a Simple Flare
From RHESSI Wiki
| Nugget | |
|---|---|
| Number: | 221 |
| 1st Author: | Zongjun Ning |
| 2nd Author: | Hugh Hudson |
| Published: | 17 March 2014 |
| Next Nugget: | Empirical Constructs and Cartoons |
| Previous Nugget: | A Wonderful Cycle 24 Flare |
| List all | |
Contents |
Introduction
Solar flares often exhibit nearly regular variations of emission at various wavelengths. In solar physics we often call such variations "quasi-period oscillations," or QPOs, and they occur so commonly that they clearly represent a significant feature of the physical processes in flares. Note that these are physically very distinct from the non-solar QPOs, which require the presence of a compact object and an accretion disk. Previous RHESSI Nuggets (7, 18, [102], [132], [148], [150], [161], 204) have discussed other events and examples, including some non-solar ones.
Although these phenomena are quite numerous by now, there is no consensus yet on the meaning of the word "oscillation" in the solar context. In some cases it is not clear whether the repetitive outbursts are wave-like in nature, and so the word "pulsation" is also frequently used. Clearly the isolation of QPO emissions via imaging observations provides important clues to help identify the physics, and in this Nugget we describe RHESSI imaging observations of pulsations in the event SOL2002-12-26T05:52 (B8.1).
Solar flare emissions are observed to display quasi-periodic oscillations in a broad frequency range, from radio through visible and extreme-ultraviolet (EUV) light to X-rays. The typical periods of these oscillations range from a few milliseconds to several minutes. The fundamental physical processes of these oscillations in solar flares are thought to be relevant to magnetic reconnection, MHD waves, particle acceleration, thermodynamics, and other kinetic effects. There are also many descriptions of such oscillations as coronal seismology, in the sense that the quasi-periodic oscillations with periods of several minutes could provide remote diagnostics of the coronal plasma.
Observations
With its full-disk solar imaging capability, wide energy coverage, and high sensitivity, RHESSI provides unprecedented capability for investigating quasi-periodic oscillations in the 3 - 6 keV thermal range, with high temporal resolution. Here, we analyze the imaging observations of a quasiperiodic oscillation at 3 - 6 keV for a GOES B8-class flare (SOL2002-12-26T04:52). Note that this is not a major flare by any means, but that RHESSI sensitivity allows us [Ref. 1] to study it in full detail anyway. Figure 1 shows an overview of the event.

The time-series analysis of the RHESSI sources involved a Fourier separation into fast (8-240 s periods) and slow (> 240 s) variations, and wavelet analysis then suggests a dominant 2-min period for the fast variations. The individual episodes can be tracked in individual images at 8-s time resolution; Figure 2 shows a few of them for illustration of the independent variability of the individual sources. Generally the time-series analysis suggests an anti-phase relationship between the sources S1 and S2 that we interpret as footpoints.

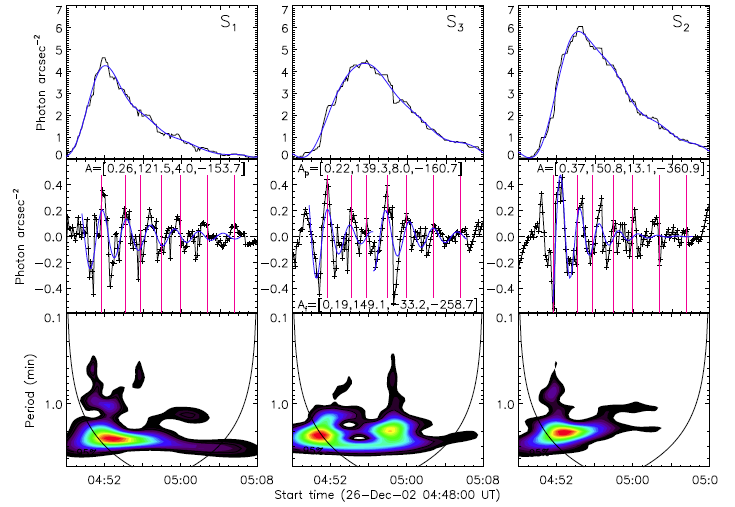
Figure 3 summarizes the time-series analysis, showing the decomposed time series, the individual peaks of the fast variations, and the wavelet spectra. The two-minute period range appears strongly in all three sources, but (as noted) not in perfect synchrony.
Conclusions
We have analyzed the quasi-periodic oscillations at X-ray emission as low as 3 – 6 keV in the flare SOL2002-12-26 as observed by RHESSI. Although only a few similarly detailed such observations have been reported in the literature, this article presented three important features: i) the low X-ray class of the observed flare, i.e. B8.1; ii) the low energies of X-ray emission at which the quasi-periodic oscillations are found, i.e. lower than about 6 keV; and iii) an attempt to reveal spatial structure of the flare sources that produce the oscillations.
RHESSI was designed for imaging spectroscopy, meaning the ability to analyze each image position spectroscopically. We might think of the analysis presented here as "time-series imaging spectroscopy" in the analogous sense of spectral properties in the time domain. This kind of analysis has the same weakness as normal imaging spectroscopy in an optically thin medium: how can we be sure that the source structure is not changing as we watch it? This is one of the problems involved in distinguishing wave effects (QPOs) from more loosely related pulsations (QPPs) that could involve independent excitations of unresolved substructures. For this event, Ref. [1] presents a detailed discussion of these problems, along with comments on systematic error sources.
Bibliography
| RHESSI Nugget Date | 17 March 2014 + |
| RHESSI Nugget First Author | Zongjun Ning + |
| RHESSI Nugget Index | 221 + |
| RHESSI Nugget Second Author | Hugh Hudson + |
