Cassini's First Closest Approach to Titan (TA)
October 26, 2004


The Cassini Orbiter will fly by Titan as it's first closest approach on October 26, 2004. This time has
been abbreviated to Titan Approach (TA). Below are trajectory plots, which is able to be shown due to the
UCLA program. The other plots are of Titan's tori and different layers of the atmosphere. The information
for those plots were provided by codes written based off the peoples papers listed above each set of plots.
All information on this page is at TA time.
How to Create Plots
Below are the positions of the icy moons at TA.
1=Mimas, 2=Enceladus, 3=Tethys,4=Dione, 5=Rhea, 6=Titan.
Program provided by UCLA.

Trajectory Segments:
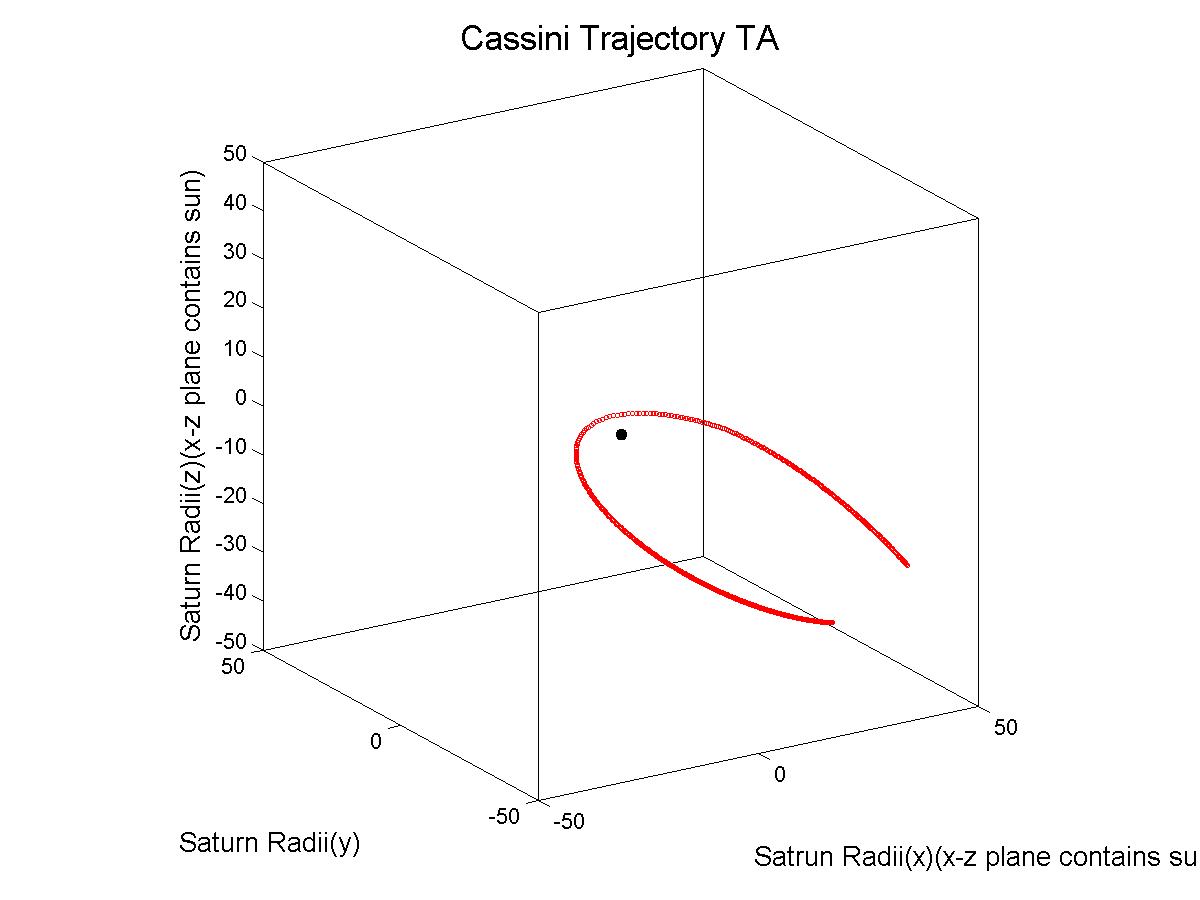
The Segments for the whole orbit =
Cassini trajectory data in Saturn Solar System or Saturn Solar Equatorial (SSEq) (AKA as Saturn Geographic)
coordinates in units of Saturn radii and degrees. Saturn centered coordinate system, Z along spin axis,
X-Z plane contains the Sun, and Y completes the right-handed set. R is the Saturn -> S/C distance.
Saturn -> S/C distance. (Rs = 62,268km).
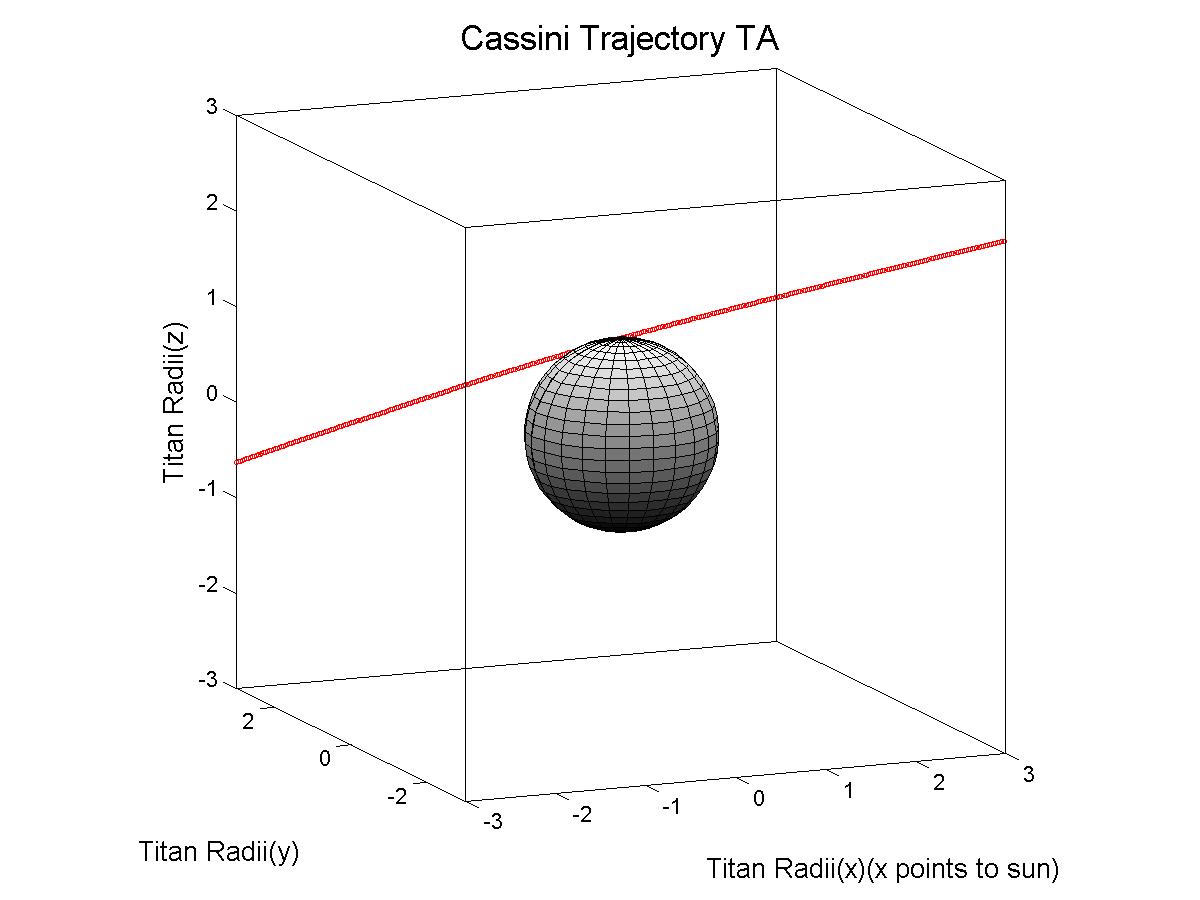
The Segments for the closer view =
Cassini trajectory data in TITAN Solar Orbital(TSO) coordinates in units of TITAN radii and degrees.
TITAN centered coordinate system, Z is parallel to the upward normal of the solar orbital plane of
Saturn, the X-Z plane contains the TITAN-Sun line, & Y completes the right-handed set and points
opposite to Saturn's motion about the Sun. R is the TITAN -> S/C distance, Zenith
angle is the 3-body (S/C - TITAN -Sun) and Local time is the projection of the 3-body angle into
the orbital plane, measured counterclockwise the TITAN anti-solar line. Rt = 2575 km.
 Titan TA Whole Orbit (xy view)
 Titan TA Whole Orbit (3d view)
 Titan TA Whole Orbit (yz view)
 Titan TA Closer View (xy view)
 Titan TA Closer View (3d view)
 Titan TA Closer View (yz view)
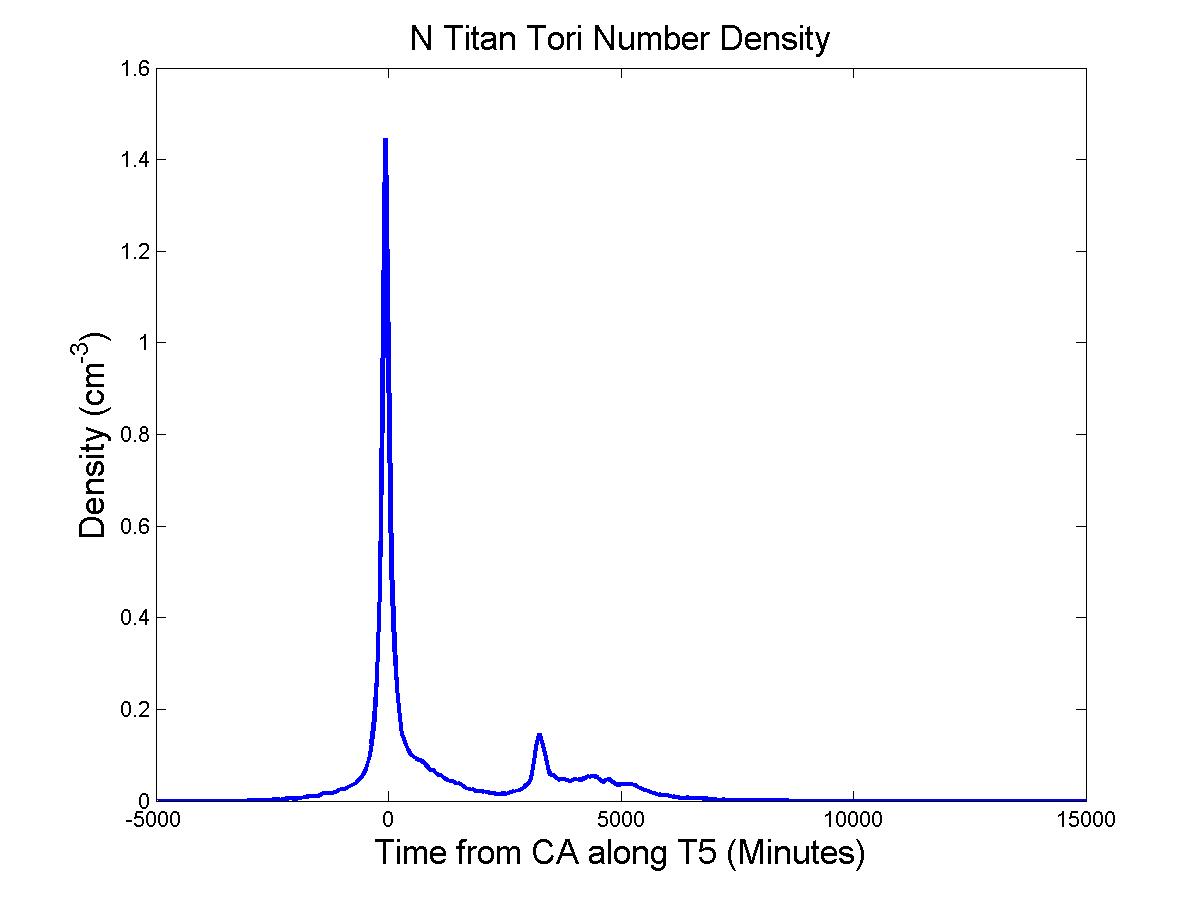
Titan Tori Density Plot:
-
H.Todd Smith1,Robert E. Johnson1, Marykutty Michael1, Valery Shematovich2 and Edward Sittler3
(1University of Virginia, 2Institute of Astronomy RAS, 3NASA GSFC)
Titan's Exosphere Density Plots:
Titan neutral exosphere models are from Amsif, Dandouras, and Roelof (JGR in press 1995)
(Sharp edges in the plots are due to the models limits. Altitude range is 1600-8000km.)
 Titan Neutral N
 Titan Neutral N2
 Titan Neutral CH4
Titan's Ionosphere Density Plots:
(The ion models assume the ionospheric density on the nightside is equal to the terminator ion density. It may be much lower, or may transition to a magnetospheric/ram source ionosphere.)
Fox-Yelle Model of Neutrals
-
Fox-Yelle model (personal communication, 1997) also see (GRL 24, p 2179, 1997)
Yung Model of Neutrals
-
Yung et al. model (ApJ Suppl. v55, p465, 1984)
(Sharp edges in the plots are due to the models limits. Altitude range is 725-9025km.)
Fox-Yelle Model of Ions
-
Fox-Yelle model (personal communication 1997)
(Sharp edges in the plots are due to the models limits. Altitude range is 600-3000km.)
-
H+, H2+, H3+
Altitude-Density Plot
-
C+, CH+, CH2+
Altitude-Density Plot
-
CH3+, CH4+, CH5+
Altitude-Density Plot
-
C2+, C2H+, C2H2+
Altitude-Density Plot
-
C2H3+,, C2H4+, C2H5+
Altitude-Density Plot
-
C2H6+, C2H7+, C4H3+
Altitude-Density Plot
-
CXHY+, N+, NH+
Altitude-Density Plot
-
NH2+, NH3+, NH4+
Altitude-Density Plot
-
HCN+, HCNH+, CN+
Altitude-Density Plot
-
C2N+, C2NZ+, N2+
Altitude-Density Plot
-
N2H+, O+, CO+
Altitude-Density Plot
-
HCO+, NO+, Ne
Altitude-Density Plot
Keller-Cravens Model of Ions with out Ram at Night
-
Keller, Cravens, Gan model (JGR v97, p12117, 1992)
(This model is SZA dependent. It also gives the electron temperature for a single nominal SZA
only (at this time). The electron temperature is used here to compute thermal pressure assuming Ti=2Te.
altitude range is 725-3015 km, except for Te and pressure which go to 2525 km only.)
-
ne, H2CN+, CxHy+
Altitude-Density Plot
-
C2H5+, CH5+, H3+
Altitude-Density Plot
-
H2+, H+, NH+
Altitude-Density Plot
-
N2H+, N2+, N+
Altitude-Density Plot
-
CN+, HCN+, CH4+
Altitude-Density Plot
-
CH3+, CH2+, CH+
Altitude-Density Plot
-
C+, C2H6+, C2H4+
Altitude-Density Plot
-
C2H3+, C2H2+, C2H+
Altitude-Density Plot
-
Z+
Altitude-Density Plot
Links To My Other Pages


 Titan TA Whole Orbit (xy view)
 Titan TA Whole Orbit (3d view)
 Titan TA Whole Orbit (yz view)
 Titan TA Closer View (xy view)
 Titan TA Closer View (3d view)
 Titan TA Closer View (yz view)
 Titan Neutral Nitrogen Tori
 Titan Neutral H
 Titan Neutral H2
 Titan Neutral N
 Titan Neutral N2