The Sun Today: Directory to the Latest Solar Images
and Interplanetary Data
The observations below have been collected
from a number
of Web sites that can be reached for
detailed information and caveats by clicking on
the highlighted labels. The images are
generally the most recent available, but are not
usually for the same time.
Visible Light Images
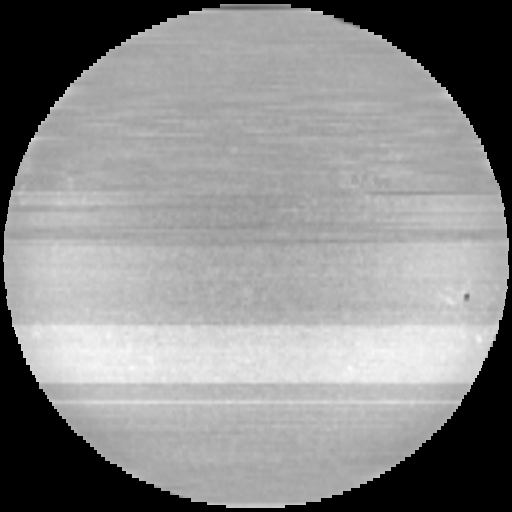
 White light image from Big Bear
Solar Observatory
(California)
White light image from Big Bear
Solar Observatory
(California)
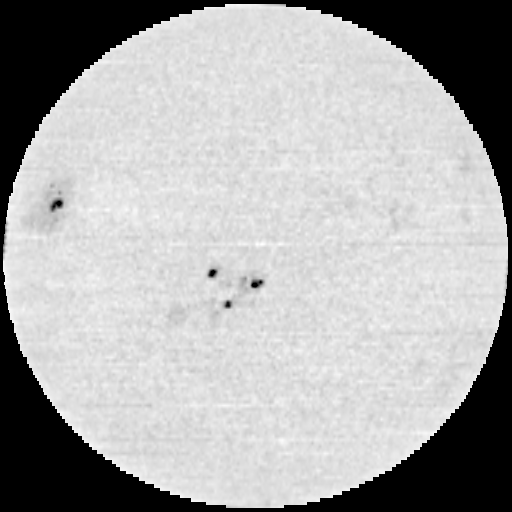
 SDO-HMI Intensity gram from SDAC at GSFC
 White light image from NSO GONG
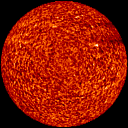
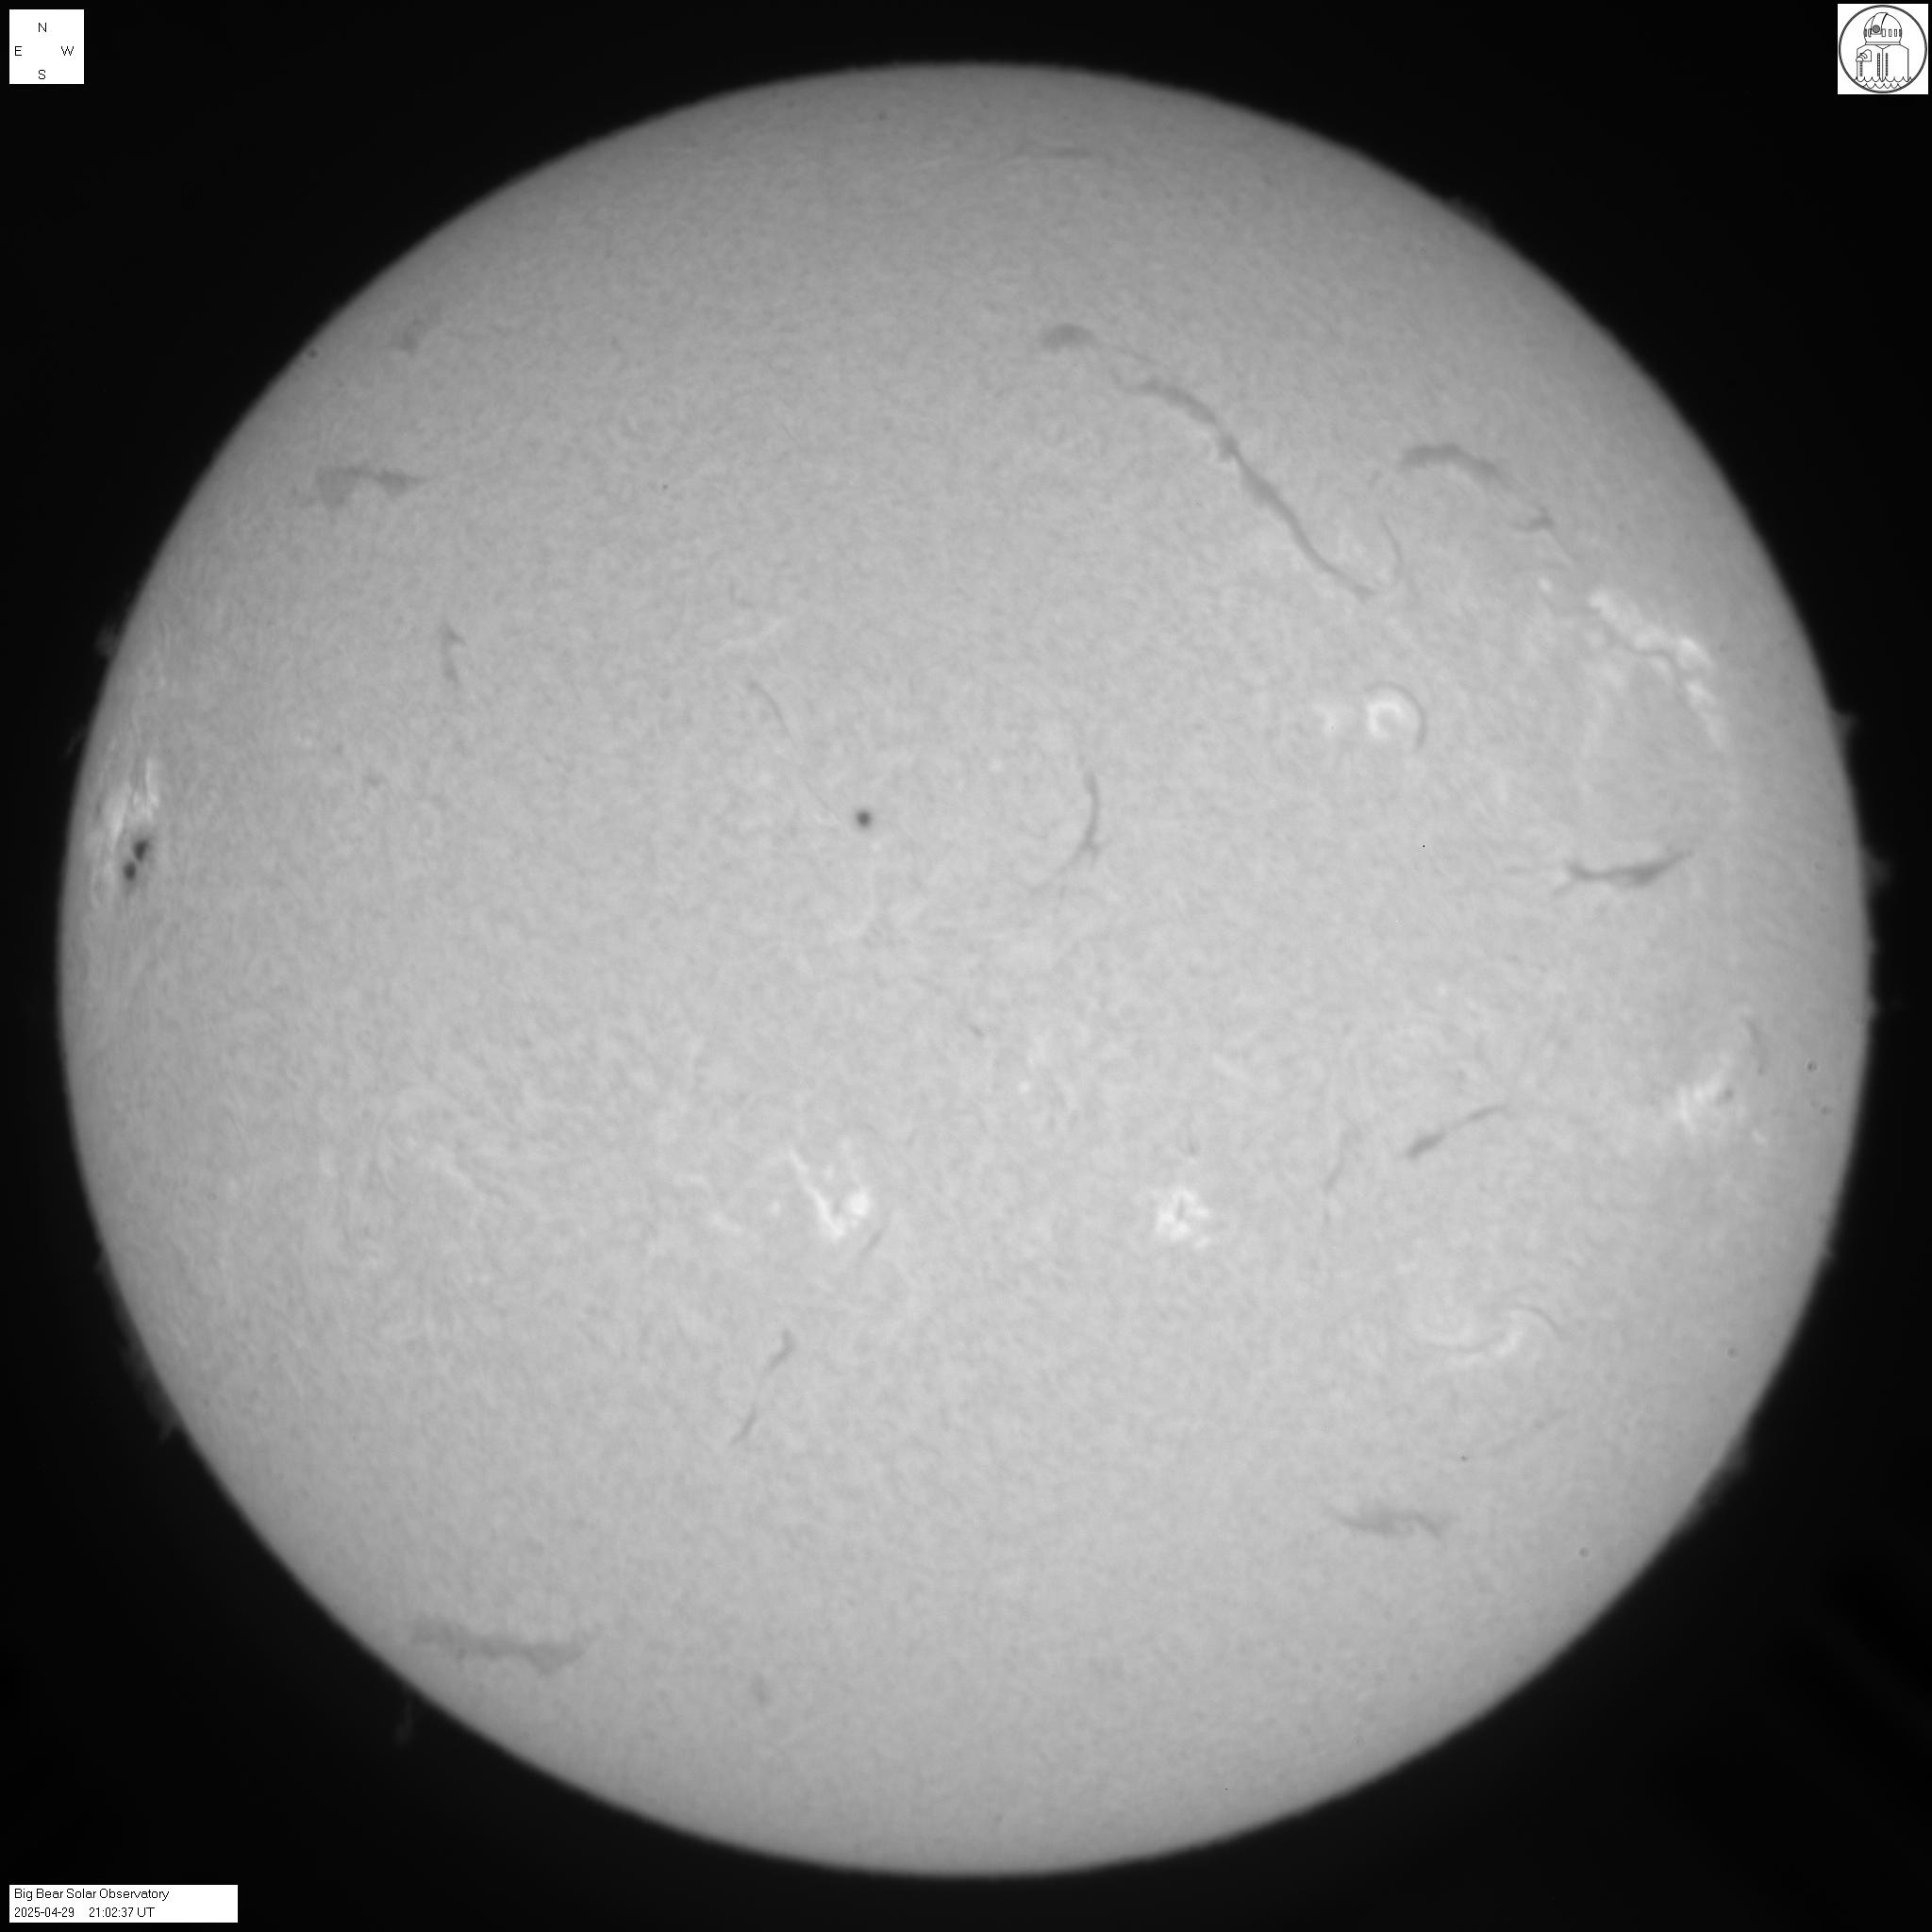 H-alpha
image from Big Bear Solar
Observatory
(California)
H-alpha
image from Big Bear Solar
Observatory
(California)
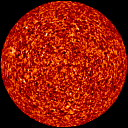
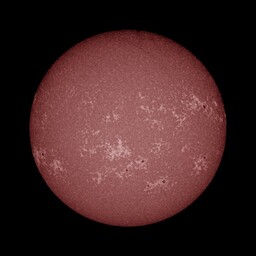
 H-alpha image from
Mauna Loa Solar Observatory
(Hawaii)
H-alpha image from
Mauna Loa Solar Observatory
(Hawaii)
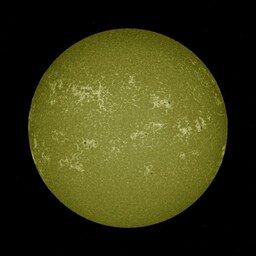
 Helium I image from
Mauna Loa Solar Observatory
(Hawaii)
Helium I image from
Mauna Loa Solar Observatory
(Hawaii)
 He I 10830 Ĺ image from SOLIS at the National Solar
Observatory, Kitt Peak (Arizona)
He I 10830 Ĺ image from SOLIS at the National Solar
Observatory, Kitt Peak (Arizona)
 Fe I line (5250.2 angstrom) image from Mt. Wilson
Observatory (California)
Fe I line (5250.2 angstrom) image from Mt. Wilson
Observatory (California)
 Na I line (5895.9 angstrom) image from Mt. Wilson
Observatory (California)
Na I line (5895.9 angstrom) image from Mt. Wilson
Observatory (California)
 Solar Dynamics Observatory (SDO)
AIA 4500 Ĺ image from
NASA Goddard Space Flight Center
SDAC
Solar Dynamics Observatory (SDO)
AIA 4500 Ĺ image from
NASA Goddard Space Flight Center
SDAC
Extreme Ultraviolet Images
 STEREO behind EUVI 195
from the STEREO mission
homepage
STEREO behind EUVI 195
from the STEREO mission
homepage
 STEREO ahead EUVI 195
from the STEREO mission
homepage
STEREO ahead EUVI 195
from the STEREO mission
homepage
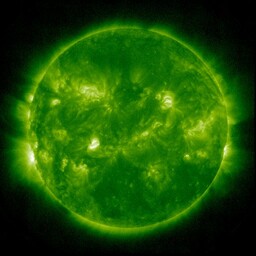
 SOHO Extreme ultraviolet Imaging Telescope (EIT) Fe XII
195 Ĺ image from
NASA Goddard Space Flight Center
SDAC
SOHO Extreme ultraviolet Imaging Telescope (EIT) Fe XII
195 Ĺ image from
NASA Goddard Space Flight Center
SDAC
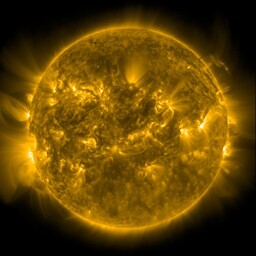
 SOHO Extreme ultraviolet Imaging Telescope (EIT) Fe IX,X
171 Ĺ image from
NASA Goddard Space Flight Center
SDAC
SOHO Extreme ultraviolet Imaging Telescope (EIT) Fe IX,X
171 Ĺ image from
NASA Goddard Space Flight Center
SDAC
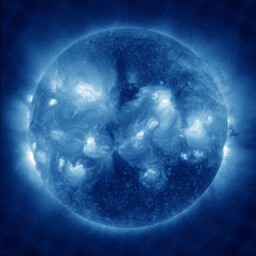
 SOHO Extreme ultraviolet Imaging Telescope (EIT) Fe XV
284 Ĺ image from
NASA Goddard Space Flight Center
SDAC
SOHO Extreme ultraviolet Imaging Telescope (EIT) Fe XV
284 Ĺ image from
NASA Goddard Space Flight Center
SDAC
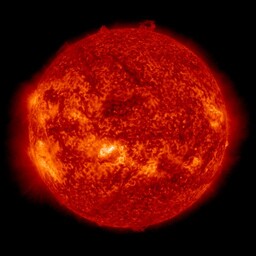
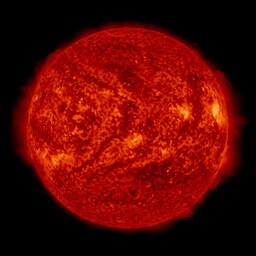
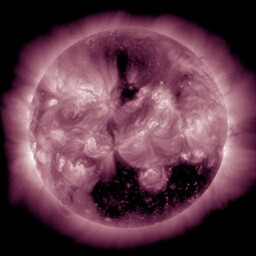
 SOHO Extreme ultraviolet Imaging Telescope (EIT) He II
304 Ĺ image from
NASA Goddard Space Flight Center
SDAC
SOHO Extreme ultraviolet Imaging Telescope (EIT) He II
304 Ĺ image from
NASA Goddard Space Flight Center
SDAC
 Solar Dynamics Observatory (SDO)
AIA 193 Ĺ image from
NASA Goddard Space Flight Center SDAC
Solar Dynamics Observatory (SDO)
AIA 193 Ĺ image from
NASA Goddard Space Flight Center SDAC
 Solar Dynamics Observatory (SDO)
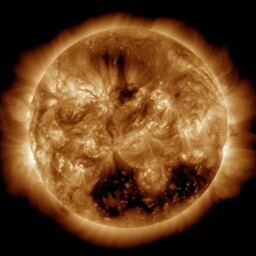
AIA 304 Ĺ image from
NASA Goddard Space Flight Center SDAC
Solar Dynamics Observatory (SDO)
AIA 304 Ĺ image from
NASA Goddard Space Flight Center SDAC
 Solar Dynamics Observatory (SDO)
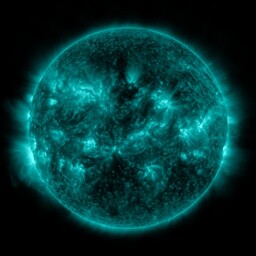
AIA 131 Ĺ image from
NASA Goddard Space Flight Center SDAC
Solar Dynamics Observatory (SDO)
AIA 131 Ĺ image from
NASA Goddard Space Flight Center SDAC
 Solar Dynamics Observatory (SDO)
AIA 221 Ĺ image from
NASA Goddard Space Flight Center SDAC
Solar Dynamics Observatory (SDO)
AIA 221 Ĺ image from
NASA Goddard Space Flight Center SDAC
 Solar Dynamics Observatory (SDO)
AIA 171 Ĺ image from
NASA Goddard Space Flight Center SDAC
Solar Dynamics Observatory (SDO)
AIA 171 Ĺ image from
NASA Goddard Space Flight Center SDAC
 Solar Dynamics Observatory (SDO)
AIA 335 Ĺ image from
NASA Goddard Space Flight Center
SDAC
Solar Dynamics Observatory (SDO)
AIA 335 Ĺ image from
NASA Goddard Space Flight Center
SDAC
 Solar Dynamics Observatory (SDO)
AIA 94 Ĺ image from
NASA Goddard Space Flight Center SDAC
Solar Dynamics Observatory (SDO)
AIA 94 Ĺ image from
NASA Goddard Space Flight Center SDAC
 Solar Dynamics Observatory (SDO)
AIA 1600 Ĺ image from
NASA Goddard Space Flight Center SDAC
Solar Dynamics Observatory (SDO)
AIA 1600 Ĺ image from
NASA Goddard Space Flight Center SDAC
 Solar Dynamics Observatory (SDO)
AIA 1700 Ĺ image from
NASA Goddard Space Flight Center SDAC
Solar Dynamics Observatory (SDO)
AIA 1700 Ĺ image from
NASA Goddard Space Flight Center SDAC
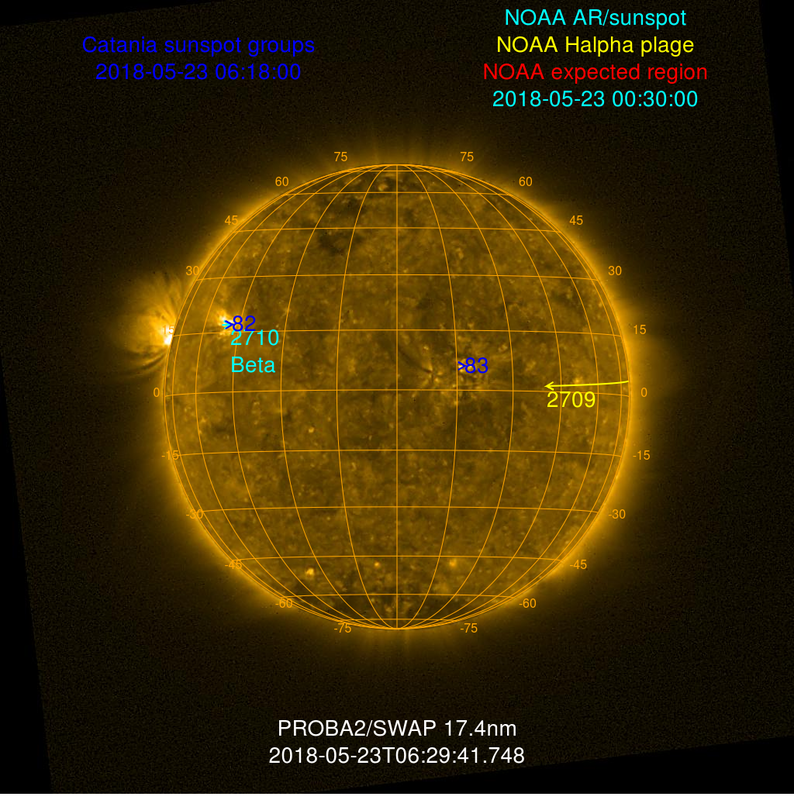
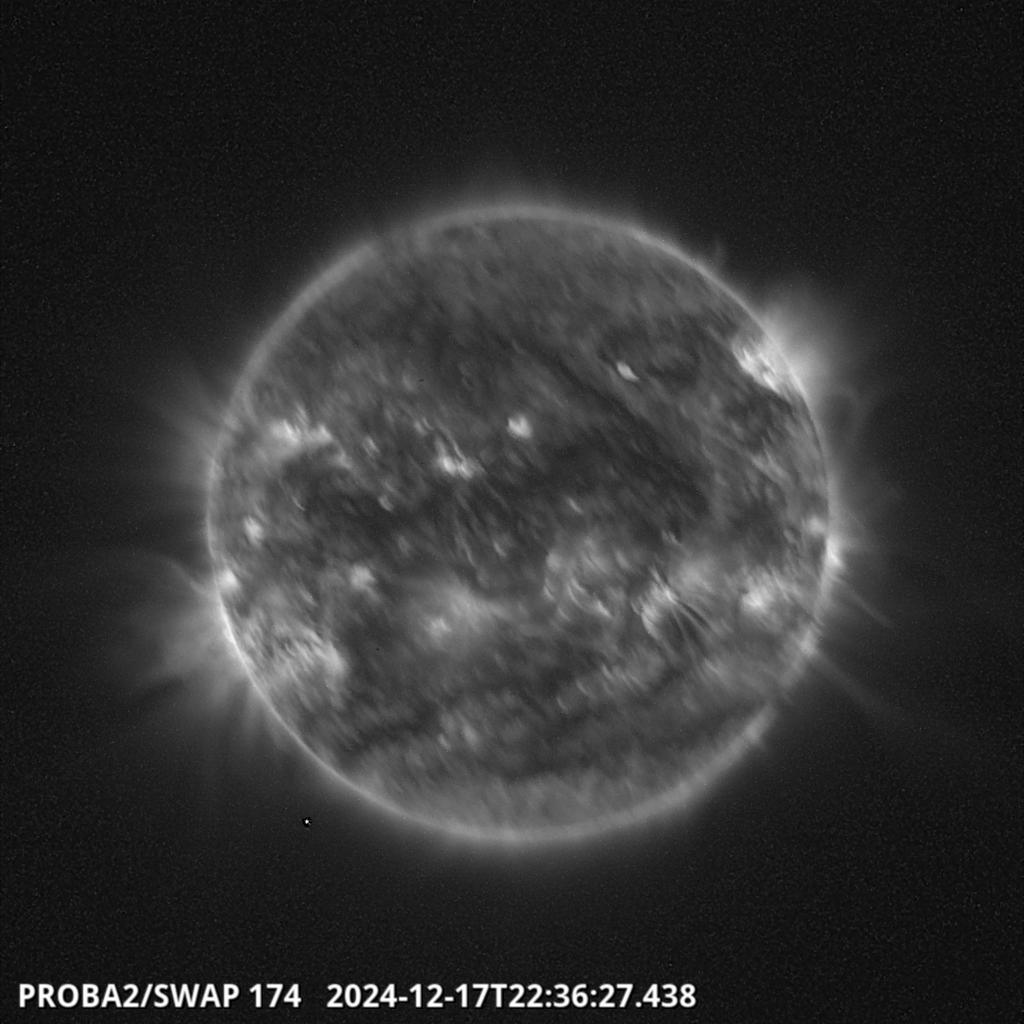 Proba2 EUV image from
Royal Observatory of Belgium - ESA
Proba2 EUV image from
Royal Observatory of Belgium - ESA
X-Ray Images and X-ray Flux
 GOES-15 X-ray image from
NOAA/SWPC Boulder, CO
GOES-15 X-ray image from
NOAA/SWPC Boulder, CO
 X-Ray image from
Hinode, JAXA
X-Ray image from
Hinode, JAXA
 Soft X-ray image from the EVE SAM pinhole camera from
NASA Goddard Space Flight Center
SDAC
Soft X-ray image from the EVE SAM pinhole camera from
NASA Goddard Space Flight Center
SDAC
 Hinode/ XRT from
JAXA
Hinode/ XRT from
JAXA
 GOES X-Ray flux from
NOAA
GOES X-Ray flux from
NOAA
Magnetograms
 Magnetogram-based synoptic
map
from
NSO/GONG
Magnetogram-based synoptic
map
from
NSO/GONG
 CaII 8542 Ĺ magnetogram from
National Solar
Observatory, Kitt Peak (Arizona)
CaII 8542 Ĺ magnetogram from
National Solar
Observatory, Kitt Peak (Arizona)
 photosphere
6302 Ĺ longitudinal magnetogram from SOLIS at the National Solar
Observatory, Kitt Peak (Arizona)
photosphere
6302 Ĺ longitudinal magnetogram from SOLIS at the National Solar
Observatory, Kitt Peak (Arizona)
 chromosphere
8542 Ĺ longitudinal magnetogram from SOLIS at the National Solar
Observatory, Kitt Peak (Arizona)
chromosphere
8542 Ĺ longitudinal magnetogram from SOLIS at the National Solar
Observatory, Kitt Peak (Arizona)
 Farside magnetic fields
obtained with helioseismology from NSO GONG
Farside magnetic fields
obtained with helioseismology from NSO GONG
 Fe I line magnetogram from
Mt. Wilson Observatory
(California)
Fe I line magnetogram from
Mt. Wilson Observatory
(California)
 Na I line magnetogram from e>a
href="http://www.astro.ucla.edu/~obs/intro.html">
Mt. Wilson Solar
Observatory
Na I line magnetogram from e>a
href="http://www.astro.ucla.edu/~obs/intro.html">
Mt. Wilson Solar
Observatory
 Magnetogram
from
Wilcox Solar Observatory (California)
Magnetogram
from
Wilcox Solar Observatory (California)
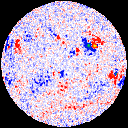
 Magnetogram from the HMI
experiment on
SDO
Magnetogram from the HMI
experiment on
SDO
Doppler Images
 Fe I dopplergram from
Mt. Wilson Observatory
(California)
Fe I dopplergram from
Mt. Wilson Observatory
(California)
 Na I dopplergram from
Mt. Wilson Observatory
(California)
Na I dopplergram from
Mt. Wilson Observatory
(California)
Radio Images
 17 GHz image from
Nobeyama Radioheliograph
(Japan)
17 GHz image from
Nobeyama Radioheliograph
(Japan)
Corona and Coronal Holes Images
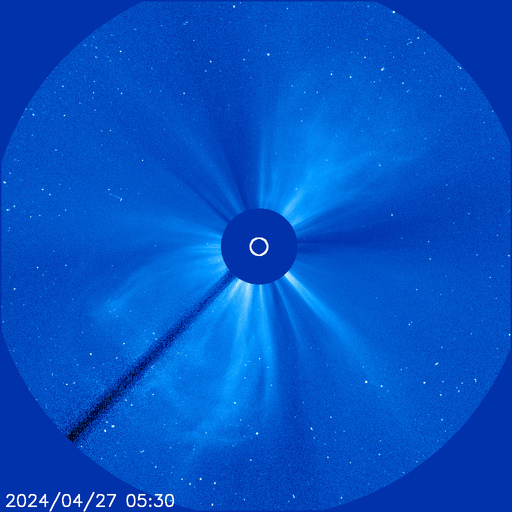
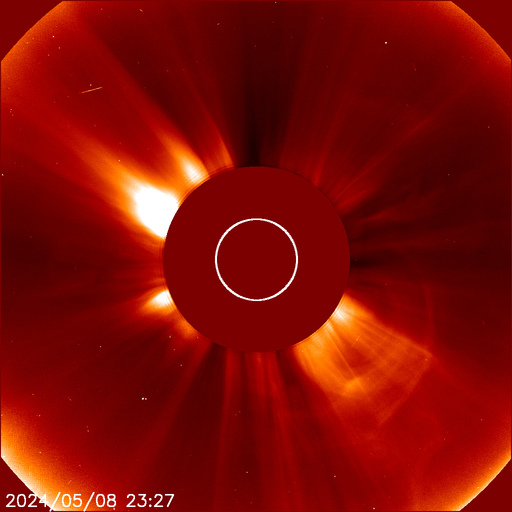
 SOHO LASCO white light image
(C2)
from the LASCO
homepages
SOHO LASCO white light image
(C2)
from the LASCO
homepages
 SOHO LASCO white light image
(C3)
from the LASCO
homepages
SOHO LASCO white light image
(C3)
from the LASCO
homepages
 FeXIV image from AFRL-NSO Sacramento Peak (New
Mexico)
FeXIV image from AFRL-NSO Sacramento Peak (New
Mexico)
 FeX image from AFRL-NSO
Sacramento Peak (New
Mexico)
FeX image from AFRL-NSO
Sacramento Peak (New
Mexico)
 FE XIV Corona Holes
from National Solar Observatory,
Sacramento Peak, CA
FE XIV Corona Holes
from National Solar Observatory,
Sacramento Peak, CA
 MK4 corona
from Mauna Loa Solar Observatory (Hawaii)
MK4 corona
from Mauna Loa Solar Observatory (Hawaii)
 SOHO LASCO (C2)
from the SOHO
homepages
SOHO LASCO (C2)
from the SOHO
homepages
 SOHO LASCO (C3)
from the SOHO
homepages
SOHO LASCO (C3)
from the SOHO
homepages
 STEREO behind
from the STEREO mission
homepage
STEREO behind
from the STEREO mission
homepage
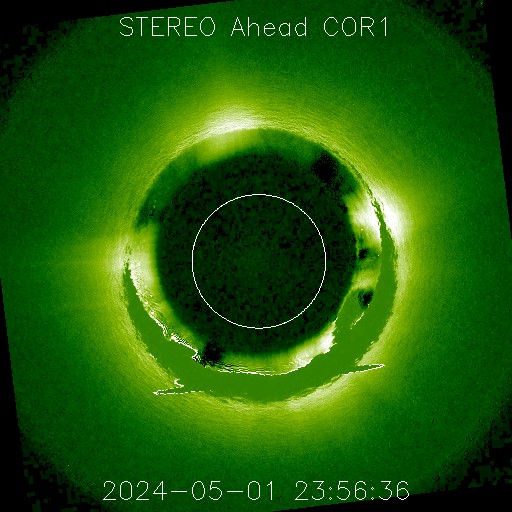 STEREO ahead
from the STEREO mission
homepage
STEREO ahead
from the STEREO mission
homepage
 STEREO behind
from the STEREO mission
homepage
STEREO behind
from the STEREO mission
homepage
 STEREO behind
from the STEREO mission
homepage
STEREO behind
from the STEREO mission
homepage
 He I 10830 Ĺ inferred coronal holes
from SOLIS at the National Solar
Observatory, Kitt Peak (Arizona)
He I 10830 Ĺ inferred coronal holes
from SOLIS at the National Solar
Observatory, Kitt Peak (Arizona)
Sunspots and Active Regions
 Active solar regions map - Earth side view
from Reben System Inc.
Active solar regions map - Earth side view
from Reben System Inc.
 Active solar regions map - far side view
from Reben System Inc.
Active solar regions map - far side view
from Reben System Inc.
 Fe XV 284 Ĺ from NOAA Space
Weather Prediction Centre
Fe XV 284 Ĺ from NOAA Space
Weather Prediction Centre
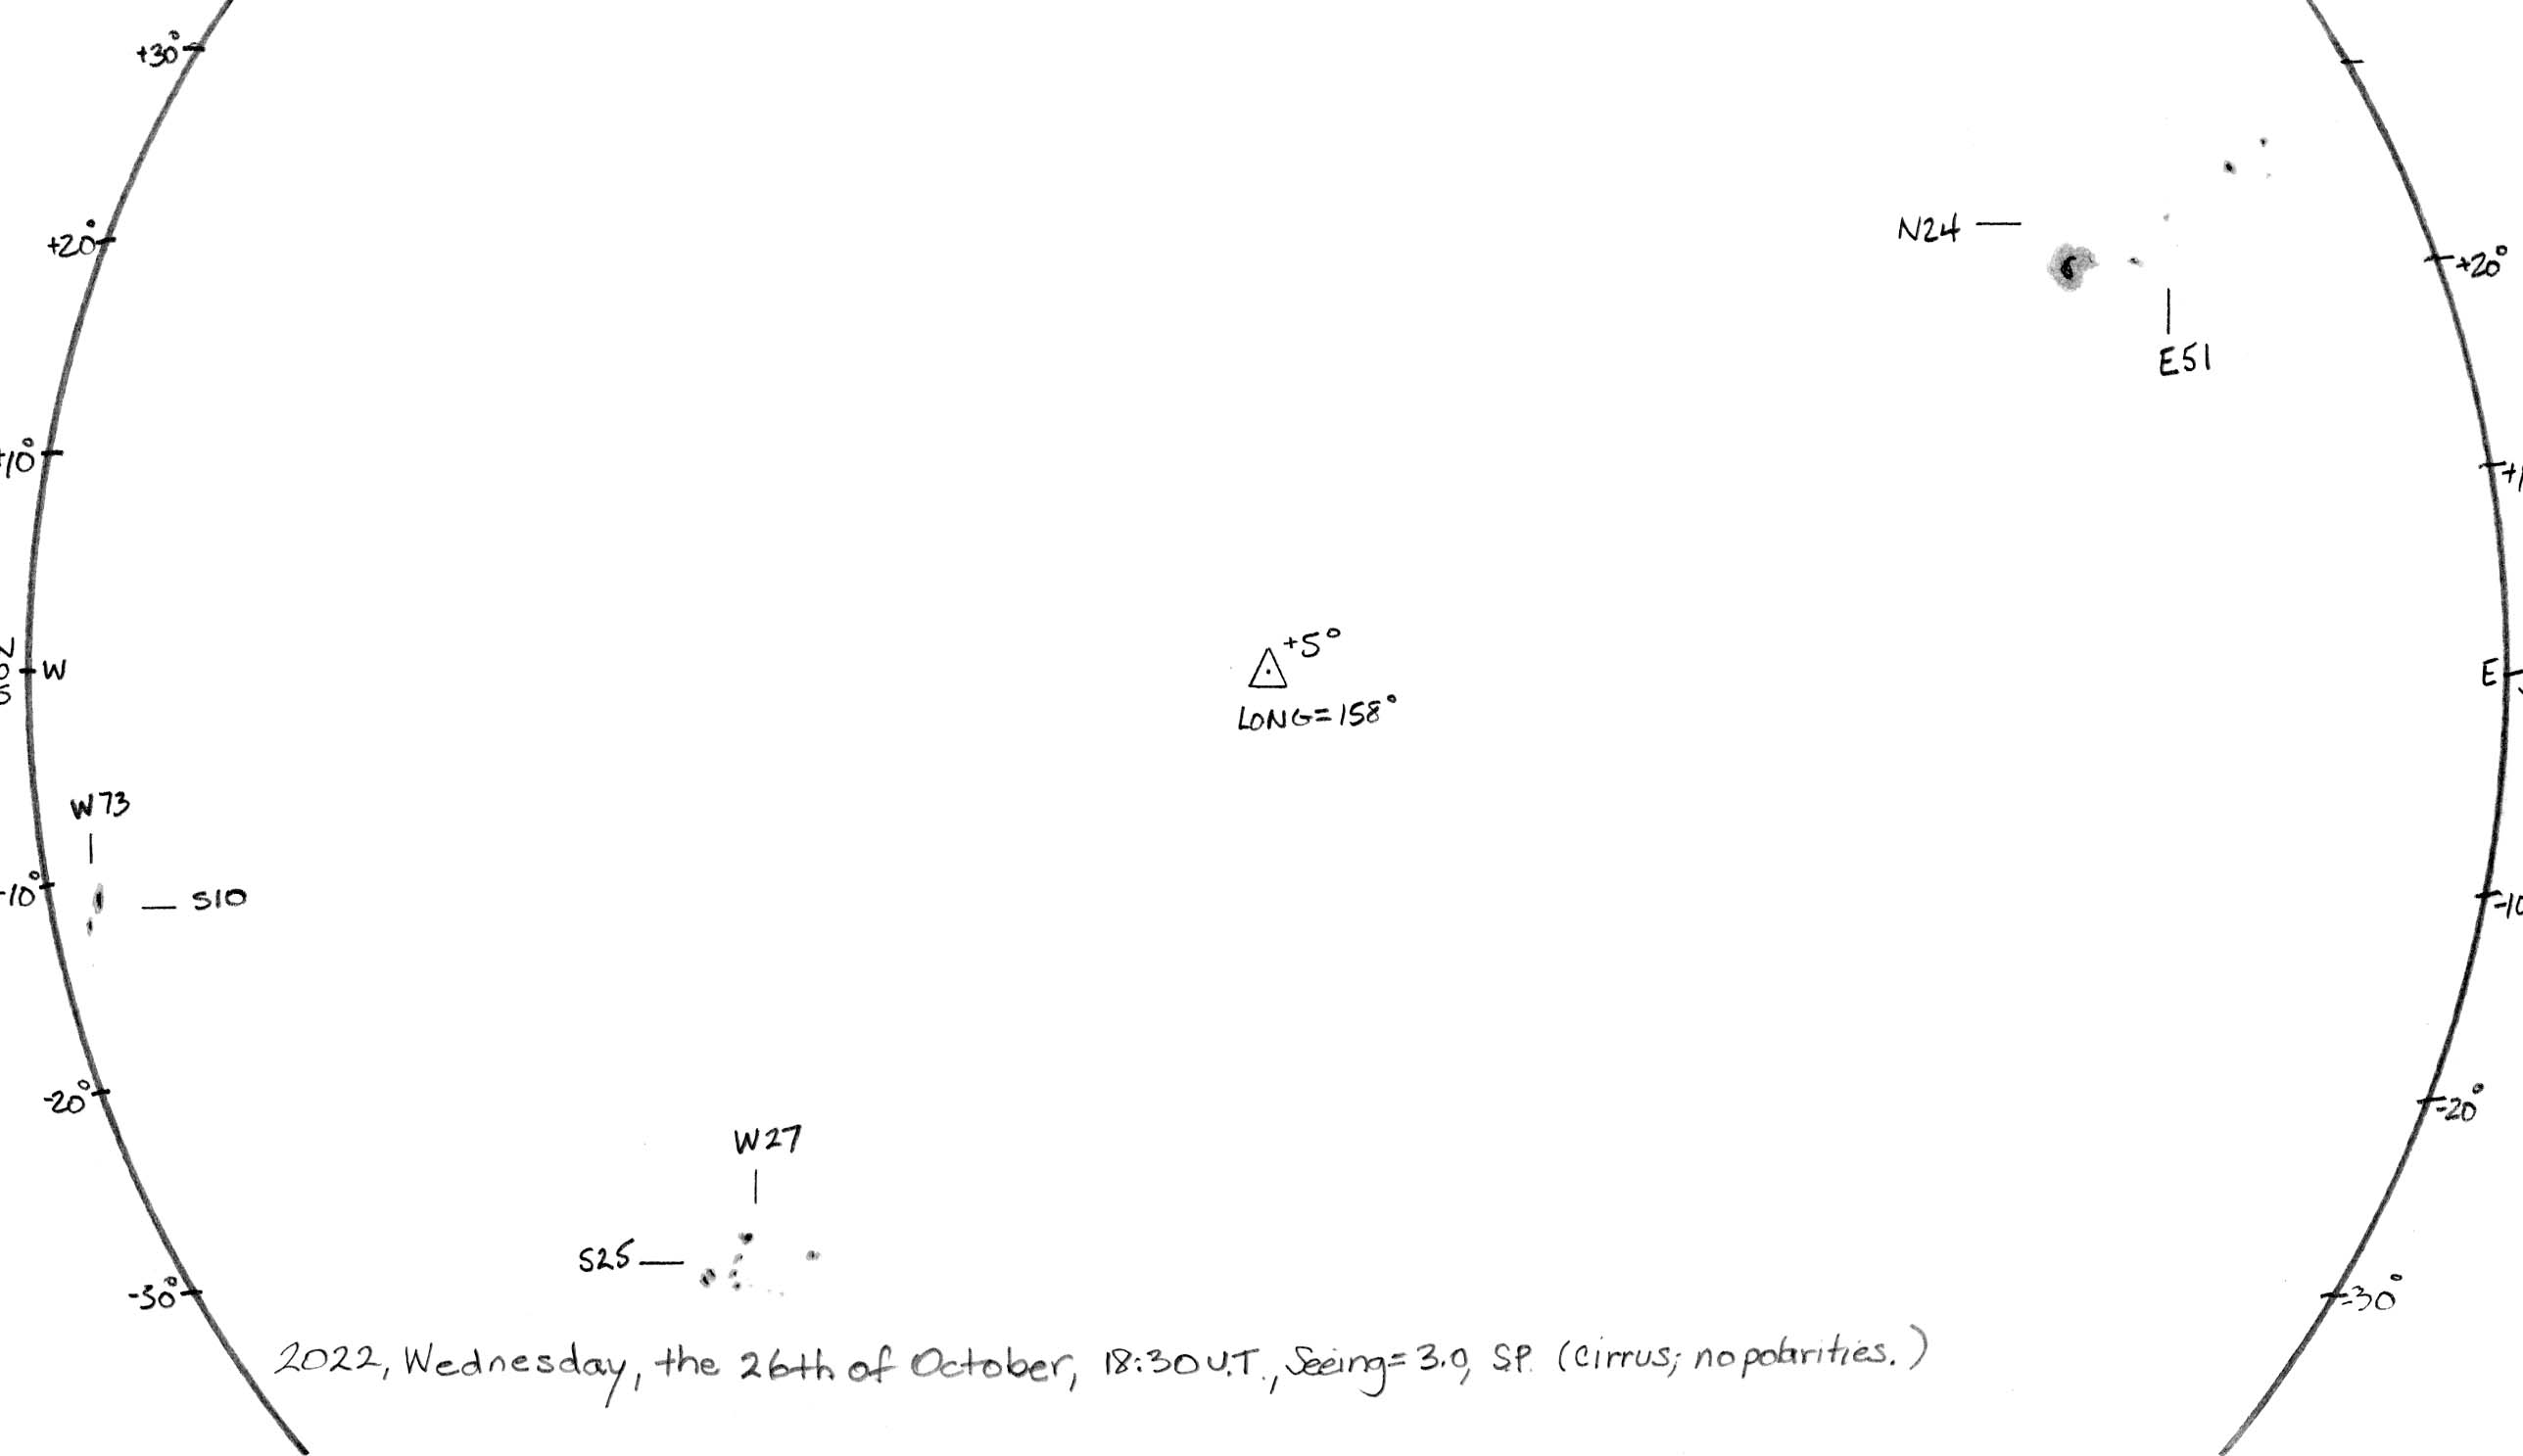
 Sunspot drawing from SIDC, Royal
Observatory of Belgium
Sunspot drawing from SIDC, Royal
Observatory of Belgium
 Sunspot number
from IPS, Sydney, Australia
Sunspot number
from IPS, Sydney, Australia
 Sunspot drawing from Mt. Wilson Solar
Observatory
(California)
Sunspot drawing from Mt. Wilson Solar
Observatory
(California)
 Active Region Maps from Mees Solar Observatory
(Hawaii)
Active Region Maps from Mees Solar Observatory
(Hawaii)
Solar Wind and Energetic Particle Information
 IMPACT solar energetic particle data from the
STEREO science centre
IMPACT solar energetic particle data from the
STEREO science centre
 STEREO IMPACT / PLASTIC Beacon and ACE Realtime solar wind data from the
STEREO science centre
STEREO IMPACT / PLASTIC Beacon and ACE Realtime solar wind data from the
STEREO science centre
 SOHO Latest 2-day interval plasma
parameters from the
University of Maryland experiment
SOHO Latest 2-day interval plasma
parameters from the
University of Maryland experiment
 SOHO Latest 2-week plasma parameters
from the
University of Maryland experiment
SOHO Latest 2-week plasma parameters
from the
University of Maryland experiment
 ACE Real Time Solar Wind 24-h
from NOAA/SWPC
ACE Real Time Solar Wind 24-h
from NOAA/SWPC
 ACE RTSW (magnetic field, speed, pressure)
from NOAA/SWPC
ACE RTSW (magnetic field, speed, pressure)
from NOAA/SWPC
 ACE RTSW magnetic field
from NOAA/SWPC
ACE RTSW magnetic field
from NOAA/SWPC
 ACE RTSW plasma
from NOAA/SWPC
ACE RTSW plasma
from NOAA/SWPC
 ACE RTSW low energy electrons & protons
from NOAA/SWPC
ACE RTSW low energy electrons & protons
from NOAA/SWPC
 ACE RTSW high energy protons
from NOAA/SWPC
Link to WIND MFI and SWF data
from NASA WIND spacecraft
ACE RTSW high energy protons
from NOAA/SWPC
Link to WIND MFI and SWF data
from NASA WIND spacecraft
Potential-Field Source-Surface models
Link to Line-Of-Sight field plot
from NSO/GONG
Link to Line-Of-Sight coronal hole plot
from NSO/GONG
Link to synoptic field plot
from NSO/GONG
If you wish to add your observations to this
page please contact jgluhman@ssl.berkeley.edu
Go to the
homepage for:
 White light image from Big Bear
Solar Observatory
(California)
White light image from Big Bear
Solar Observatory
(California)
 Solar Dynamics Observatory (SDO)
AIA 4500 Ĺ image from
NASA Goddard Space Flight Center
SDAC
Solar Dynamics Observatory (SDO)
AIA 4500 Ĺ image from
NASA Goddard Space Flight Center
SDAC
 STEREO ahead EUVI 195
from the STEREO mission
homepage
STEREO ahead EUVI 195
from the STEREO mission
homepage
 SOHO Extreme ultraviolet Imaging Telescope (EIT) Fe XII
195 Ĺ image from
NASA Goddard Space Flight Center
SDAC
SOHO Extreme ultraviolet Imaging Telescope (EIT) Fe XII
195 Ĺ image from
NASA Goddard Space Flight Center
SDAC
 SOHO Extreme ultraviolet Imaging Telescope (EIT) Fe IX,X
171 Ĺ image from
NASA Goddard Space Flight Center
SDAC
SOHO Extreme ultraviolet Imaging Telescope (EIT) Fe IX,X
171 Ĺ image from
NASA Goddard Space Flight Center
SDAC
 SOHO Extreme ultraviolet Imaging Telescope (EIT) Fe XV
284 Ĺ image from
NASA Goddard Space Flight Center
SDAC
SOHO Extreme ultraviolet Imaging Telescope (EIT) Fe XV
284 Ĺ image from
NASA Goddard Space Flight Center
SDAC
 SOHO Extreme ultraviolet Imaging Telescope (EIT) He II
304 Ĺ image from
NASA Goddard Space Flight Center
SDAC
SOHO Extreme ultraviolet Imaging Telescope (EIT) He II
304 Ĺ image from
NASA Goddard Space Flight Center
SDAC
 Solar Dynamics Observatory (SDO)
AIA 193 Ĺ image from
NASA Goddard Space Flight Center SDAC
Solar Dynamics Observatory (SDO)
AIA 193 Ĺ image from
NASA Goddard Space Flight Center SDAC
 Solar Dynamics Observatory (SDO)
AIA 304 Ĺ image from
NASA Goddard Space Flight Center SDAC
Solar Dynamics Observatory (SDO)
AIA 304 Ĺ image from
NASA Goddard Space Flight Center SDAC
 Solar Dynamics Observatory (SDO)
AIA 131 Ĺ image from
NASA Goddard Space Flight Center SDAC
Solar Dynamics Observatory (SDO)
AIA 131 Ĺ image from
NASA Goddard Space Flight Center SDAC
 Solar Dynamics Observatory (SDO)
AIA 221 Ĺ image from
NASA Goddard Space Flight Center SDAC
Solar Dynamics Observatory (SDO)
AIA 221 Ĺ image from
NASA Goddard Space Flight Center SDAC
 Solar Dynamics Observatory (SDO)
AIA 171 Ĺ image from
NASA Goddard Space Flight Center SDAC
Solar Dynamics Observatory (SDO)
AIA 171 Ĺ image from
NASA Goddard Space Flight Center SDAC
 Solar Dynamics Observatory (SDO)
AIA 335 Ĺ image from
NASA Goddard Space Flight Center
SDAC
Solar Dynamics Observatory (SDO)
AIA 335 Ĺ image from
NASA Goddard Space Flight Center
SDAC
 Solar Dynamics Observatory (SDO)
AIA 94 Ĺ image from
NASA Goddard Space Flight Center SDAC
Solar Dynamics Observatory (SDO)
AIA 94 Ĺ image from
NASA Goddard Space Flight Center SDAC
 Solar Dynamics Observatory (SDO)
AIA 1600 Ĺ image from
NASA Goddard Space Flight Center SDAC
Solar Dynamics Observatory (SDO)
AIA 1600 Ĺ image from
NASA Goddard Space Flight Center SDAC
 Solar Dynamics Observatory (SDO)
AIA 1700 Ĺ image from
NASA Goddard Space Flight Center SDAC
Solar Dynamics Observatory (SDO)
AIA 1700 Ĺ image from
NASA Goddard Space Flight Center SDAC
 GOES-15 X-ray image from
NOAA/SWPC Boulder, CO
GOES-15 X-ray image from
NOAA/SWPC Boulder, CO
 X-Ray image from
Hinode, JAXA
X-Ray image from
Hinode, JAXA
 Hinode/ XRT from
JAXA
Hinode/ XRT from
JAXA
 GOES X-Ray flux from
NOAA
GOES X-Ray flux from
NOAA
 FE XIV Corona Holes
from National Solar Observatory,
Sacramento Peak, CA
FE XIV Corona Holes
from National Solar Observatory,
Sacramento Peak, CA
 SOHO LASCO (C2)
from the SOHO
homepages
SOHO LASCO (C2)
from the SOHO
homepages
 STEREO behind
from the STEREO mission
homepage
STEREO behind
from the STEREO mission
homepage
 STEREO behind
from the STEREO mission
homepage
STEREO behind
from the STEREO mission
homepage
 Sunspot drawing from SIDC, Royal
Observatory of Belgium
Sunspot drawing from SIDC, Royal
Observatory of Belgium
 ACE Real Time Solar Wind 24-h
from NOAA/SWPC
ACE Real Time Solar Wind 24-h
from NOAA/SWPC
 ACE RTSW (magnetic field, speed, pressure)
from NOAA/SWPC
ACE RTSW (magnetic field, speed, pressure)
from NOAA/SWPC
 ACE RTSW plasma
from NOAA/SWPC
ACE RTSW plasma
from NOAA/SWPC
 ACE RTSW low energy electrons & protons
from NOAA/SWPC
ACE RTSW low energy electrons & protons
from NOAA/SWPC
 ACE RTSW high energy protons
from NOAA/SWPC
Link to WIND MFI and SWF data
from NASA WIND spacecraft
ACE RTSW high energy protons
from NOAA/SWPC
Link to WIND MFI and SWF data
from NASA WIND spacecraft